A Statistical Analysis Of Implications Of Using The “China Virus” Phrase

Trump used it. A reader wrote “A China virus is not racist, it’s placist.” My view is that since there was already a widely known term for the virus, it was unnecessary to resort to a made up moniker. Han, Riddell and Piquero (2023) examines what happened in the aftermath of the popularization of the term.
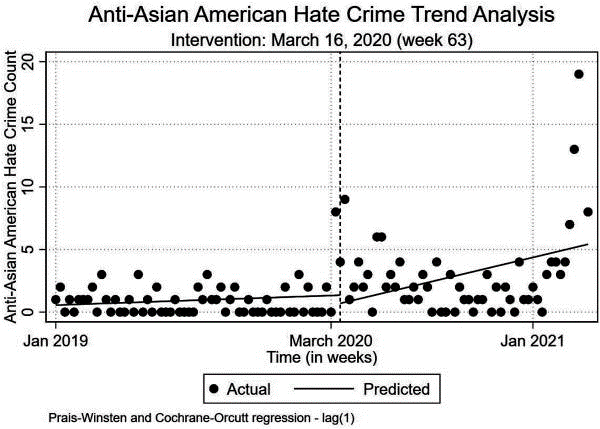
Source: Han, Riddell, Piquero (2023).
The authors estimate a regression of hate crime count on constant, time, a dummy taking on the value of one after March 16, 2020, and a time trend starting from March 16, 2020.
The coefficient on time (where each observation is weekly) is 0.075, with standard error of 0.056. The authors conclude that none of the coefficients are statistically significant, using 2-tailed tests. Note that the t-statistic of 1.32, is significant at the 10% msl for a one-tailed t-test, which is in some sense more appropriate if one believes the relevant alternative hypothesis is that crimes rose more rapidly after the use of the terms “Kung Flu” or “China virus”. Note that these are results based on data from four major cities, as described in the paper.
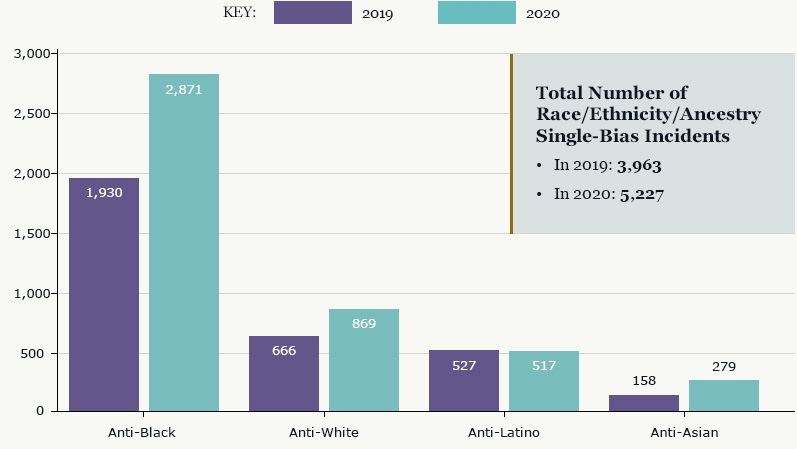
Aggregate national (but likely downwardly biased for AAPI group) data from the FBI for 2020 here.
Source: FBI (February 2023).
This is a 77% increase in hate crimes against Asian individuals in the US in 2020.
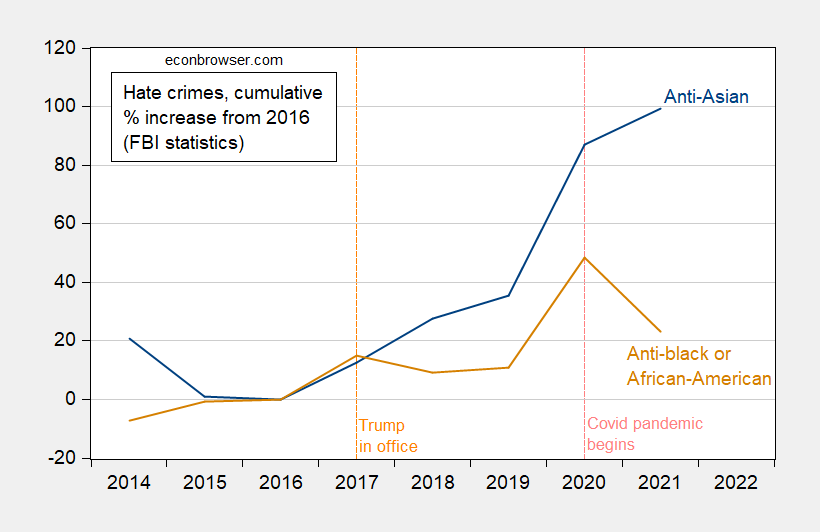
Here’s a time series, which shows the discrete jump in anti-Asian hate crimes in 2020.
Figure 1: Anti-Asian hate crimes (blue), and Anti-black or anti-African-American hate crimes (tan), in cumulative percentage change from 2016 (log terms). Source: FBI Crime Data Explorer, and author’s calculations.
In contrast to the Han et al. study, there is some evidence of persistence in reported anti-Asian hate crimes.
For more discussion of the FBI hate crimes data limitations, and findings from other datasets, see this Vox discussion.
Addendum:
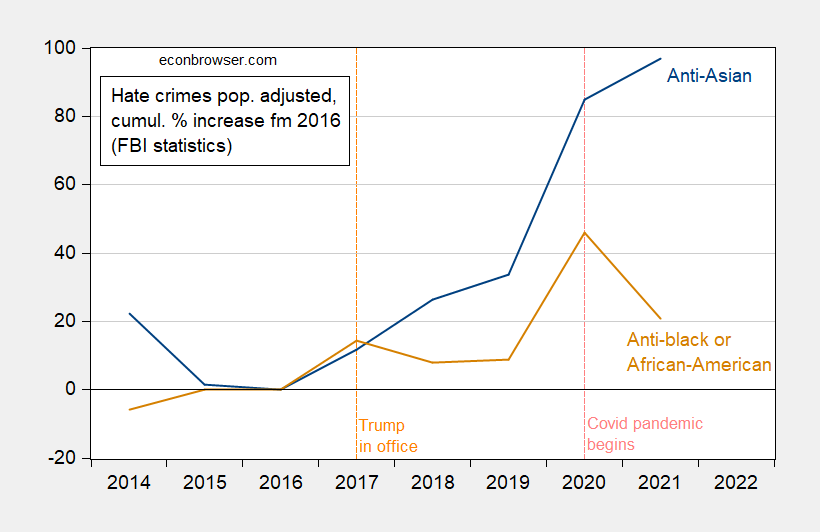
Lest someone argue that population size has put upward drift into the series, here are the population adjusted counterparts to those in Figure 1.
Figure 2: Anti-Asian hate crimes as a proportion of population (blue), and Anti-black or anti-African-American hate crimes as a proportion of population (tan), in cumulative percentage change from 2016 (log terms). Source: FBI Crime Data Explorer, BEA via FRED (POPTHM), and author’s calculations.
More By This Author:
PCE Inflation For February
Business Cycle Sit-Rep, End-March
Weekly Macro Indicators Through March 25


