
With the release of the personal income and spending release, we have real consumption (-0.1% vs. 0.0% m/m consensus) and personal income through February; also released today is real manufacturing and trade industry sales. Below, in the graph of key business cycle series followed by the NBER Business Cycle Dating Committee, I add the 3rd release of 2022Q4 GDP (discussed in the context of GDO and GDP+ in yesterday’s post).
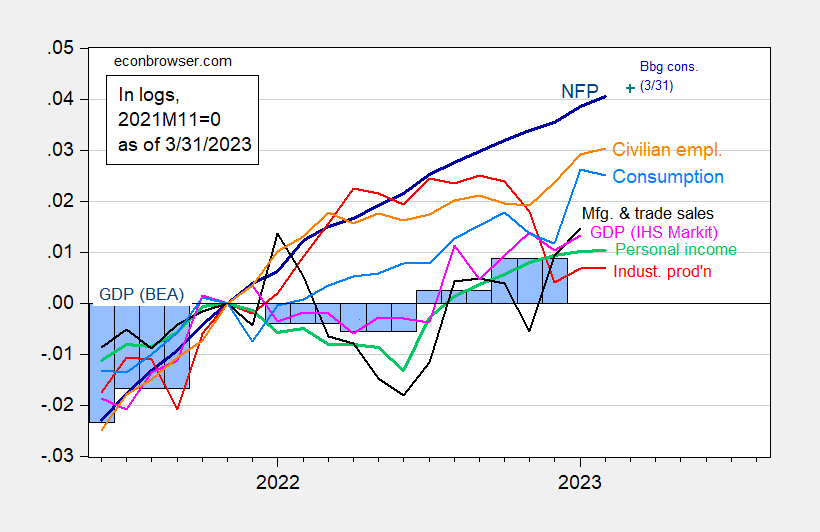
Figure 1: Nonfarm payroll employment, NFP (dark blue), Bloomberg consensus of 3/31 (blue +), civilian employment (orange), industrial production (red), personal income excluding transfers in Ch.2012$ (green), manufacturing and trade sales in Ch.2012$ (black), consumption in Ch.2012$ (light blue), and monthly GDP in Ch.2012$ (pink), GDP (blue bars), all log normalized to 2021M11=0. Q3 Source: BLS, Federal Reserve, BEA 2022Q4 3rd release via FRED, S&P Global/IHS Markit (nee Macroeconomic Advisers) (3/1/2023 release), and author’s calculations.
Weekly Economic Indicators (Lewis-Mertens-Stock) for data available through March 25 (see discussion here) indicates 1.47% for y/y growth, implying 2.37% q/q for Q1. GDPNow as of today indicates Q1 growth of 2.9% q/q SAAR, while S&P Market Intelligence/formerly IHS Markit has raised its tracking estimate to 1.8% (q/q SAAR), up from 0.8%, all due to higher than anticipated consumption.
There has been some concern that labor market measurements have been off track, particularly with respect to the establishment survey series. The recent release of the QCEW data has put some of those concerns to rest (see this post). However, for completeness sake, consider the Philadelphia Fed coincident index (which is largely based on labor market data including wages and salaries), the ADP private NFP employment series (based on a completely different data set than the BLS establishment survey) and civilian employment series adjusted to the NFP concept (based on the household survey).
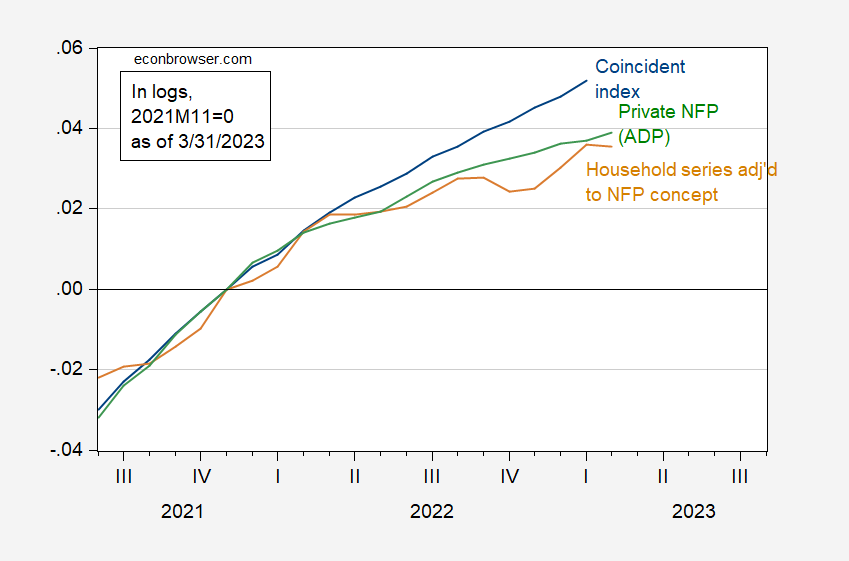
Figure 2: Coincident index (blue), civilian employment adjusted to NFP concept (tan), and ADP nonfarm payroll employment series (green), all in logs, 2021M11=0. Source: Philadelphia Fed, ADP via FRED, BLS, and author’s calculations.
More By This Author:
Weekly Macro Indicators Through March 25GDP (3rd), GDO, GDP+
Deposits On The Move


Comments
Log in or sign up to join the conversation.