A Rolling Recession From A Rolling Expansion?
I see increasing speculation ([1], [2]) that we might avoid a recession by virtue of having rolling recessions. Usually, the argument is that the slowdowns are hitting different industries, although one could also take a geographical view. Here I discuss both the industry and geographical variation.
First, the conventional view, through the lens of real value added.

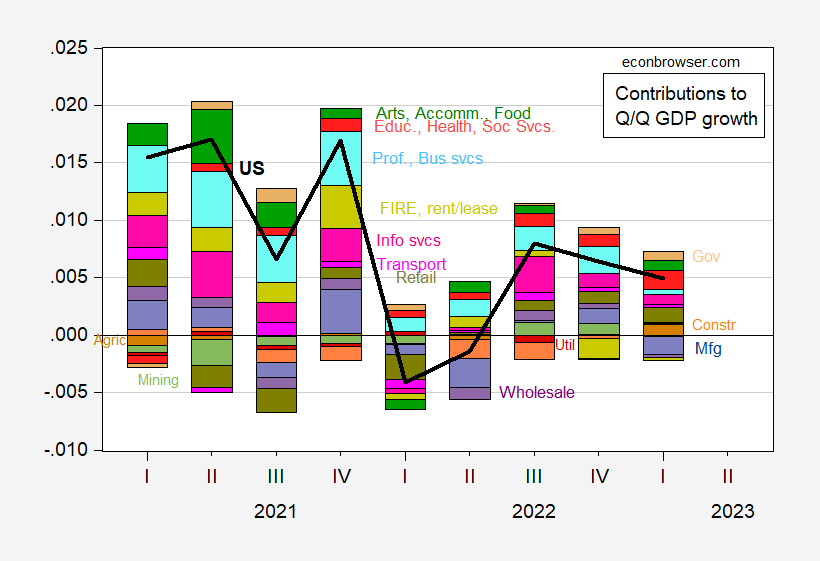
Figure 1: Quarter-on-quarter real GDP growth (bold black line), and contribution to quarter-on-quarter GDP growth from real value added by industry (bars). Source: BEA and author’s calculations.
Notice that in the 2022H1 slowdown, no sector was continuously contributing negatively or positively except professional and business services (which includes computer system design and administration). Compare this with the recession of 2007-09.

Figure 2: Quarter-on-quarter real GDP growth (bold black line), and contribution to quarter-on-quarter GDP growth from real value added by industry (bars). NBER defined peak-to-trough recession dates shaded gray. Source: BEA, NBER, and author’s calculations.
Finance, insurance, real estate (FIRE), and rental and leasing led in a big way the downturn, and manufacturing followed.
Now we don’t yet have 2023Q2 disaggregate industry data (9/28 is the next release), so we don’t know the pattern in contributions right now.
Geographical Variation
The expansion has shown a wide variation in growth across BEA regions.

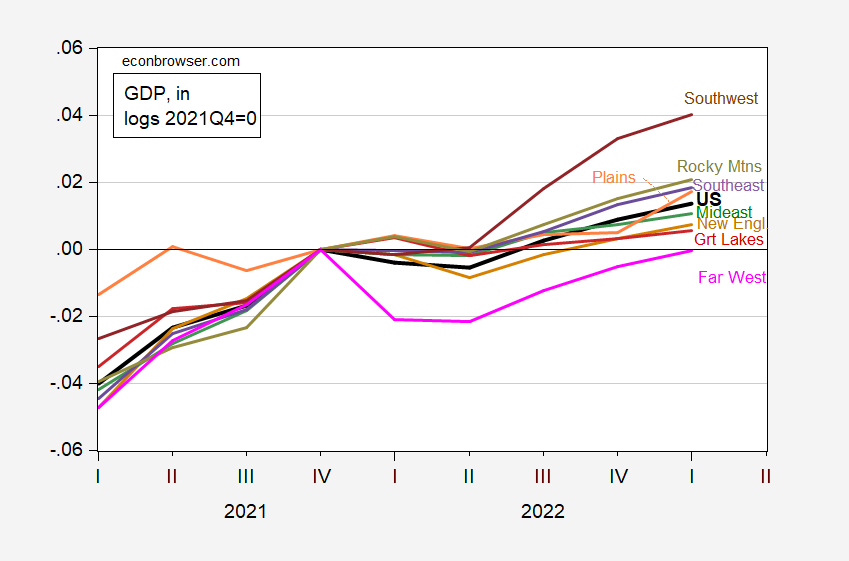
Figure 3: Log GDP in US (bold black), and in BEA regions, all 2021Q4=0. Source: BEA and author’s calculations.
Figure 3 indicates that the GDP slowdown in 2022H1 was concentrated in the Far West, and to a lesser extend New England. The Southwest is growing much faster than the rest-of-the-nation.
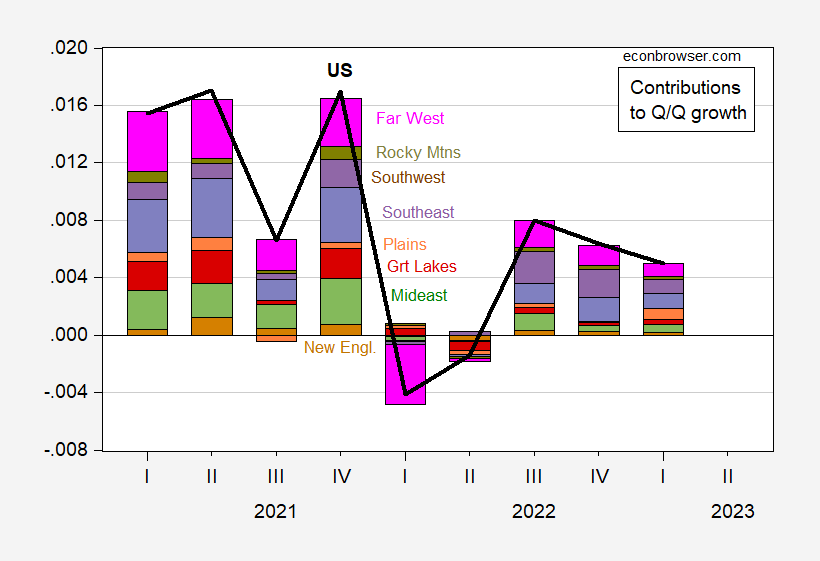
In terms of contributions to GDP growth, the Far West is the main component of the 2022Q1 downturn, in an accounting sense.

Figure 4: Quarter-on-quarter growth rate of US (bold black line), and in BEA regions (bars), not annualized. Source: BEA and author’s calculations.
I’m tempted to interpret the big drop in Far West GDP as being associated with the large drop in the contribution from Professional and Business services (which includes computer system design and administration) and Information services. The data support this interpretation, in an accounting sense. Of the 8.0% q/q (SAAR) decline in Far West GDP in Q1, 3.7 percentage points were accounted for by the decline in professional and business services, and information services combined.
Note that the outsize effect of the Far West in terms of contribution to GDP is that it is both large in economic size (as shown in Figure 5), and in this context, variable (as shown in Figure 3).

Figure 5: GDP of US (bold black line), and in BEA regions (bars), mn Ch.2012$ SAAR. Source: BEA.
So as of Q1, the expansion seems to be geographically broad-based. That doesn’t mean a shock in one region (or industry) won’t propagate strongly to other regions – saying yes or no to that quesiton relies on a causal model.
More By This Author:
Why I Think Private Employment Grew Through April (And Maybe Through July)Business Cycle Indicators, With New Employment Numbers
Is It Safe? Considering The End Of The Recession Call


