
Apologies to Laurence Olivier in “Marathon Man”. Derek Thomson of the Atlantic describes “How the Recession Doomers Got the U.S. Economy so Wrong”.Personally, I don’t think we should take the recession scenario off the table, despite the recent spate of good data. First, term spread models implied a downturn/recession in the 4th quarter of 2023 (using a 50% threshold), and we’re still in the 3rd quarter. Second, these data are going to be revised — and GDP in particular will be heavily revised.
To the first point, I reprise the graph of probabilities derived from term spread models in this June assessment.
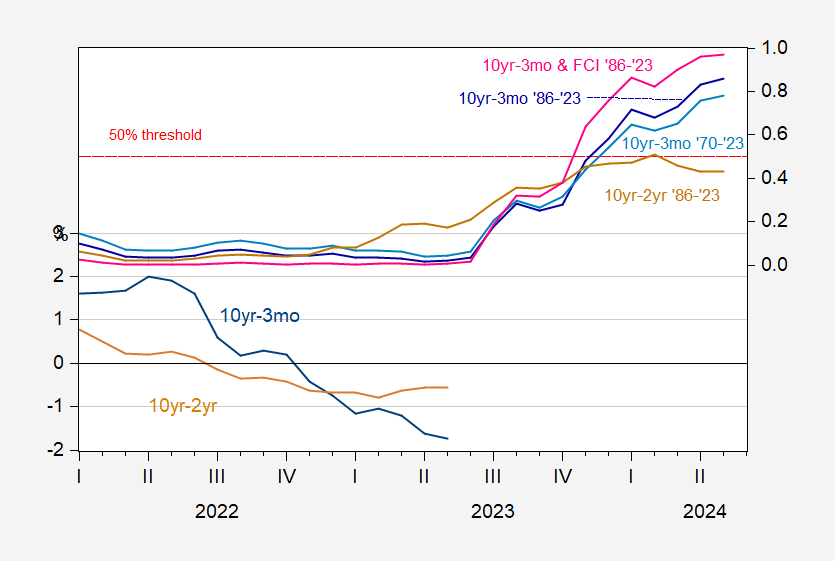
Figure 1: 10yr-3mo Treasury spread (blue, left scale), and 10yr-2yr spread (tan, left scale), both in %; and probability of recession from 10yr-3mo over 1986-2023M05 period (dark blue, right scale), augmented by Financial Conditions Index (pink, right scale), 10yr-3mo term spread over1970-2023M05 (light blue, right scale), and 10yr-2yr over 1986-2023M05 period (brown, right scale). NBER defined peak-to-trough recession dates shaded gray. Regressions assume no recession occurred as of May 2023. Source: Treasury via FRED, Chicago Fed via FRED, NBER, and author’s calculations.
So, if historical correlations hold into the 2023-24 period, then a recession is not unlikely, according to these term spread/probit models.
To the second point, I hearken back to my own experiences when as a senior economist in the government, I was told the currently reported data assured no recession by one of my colleagues. That was in April or May 2001, if memory serves. We were already a month into the recession by that time.
To make this point more concrete, consider the data we had available at the end of April 2001; this is shown in the top blue line in Figure 2 below.
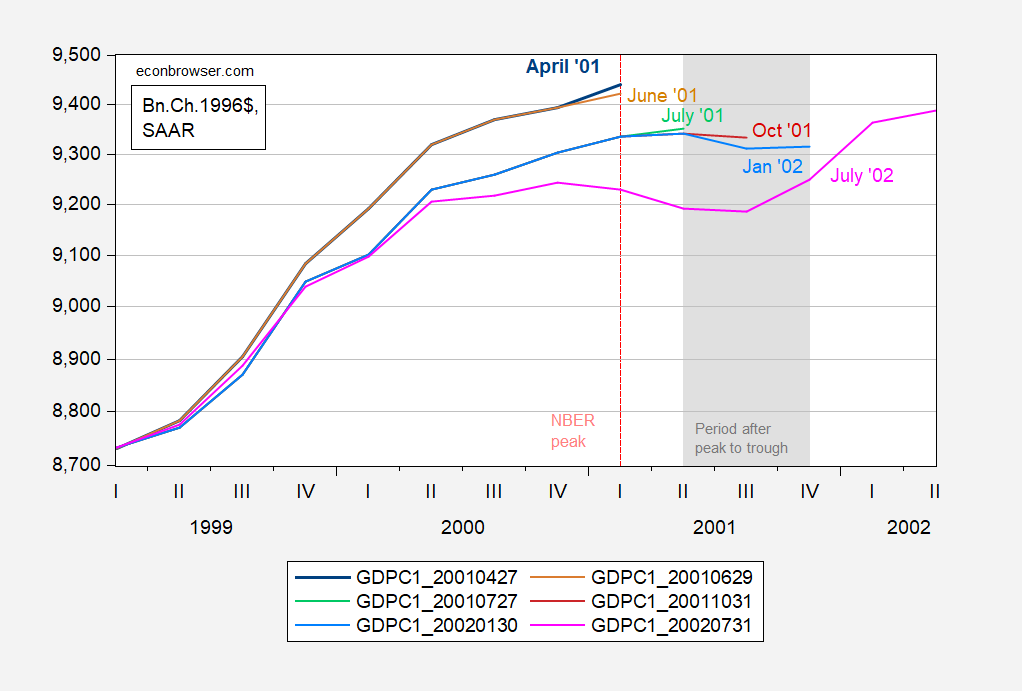
Figure 2: GDP in bn.Ch.1996$ SAAR from April 2001 release (bold blue), from June 2001 (tan), from July 2001 (light green), October 2001 (red), January 2002 (sky blue), July 2002 (pink). NBER defined period after peak to trough recession dates shaded gray. Dashed red line at NBER peak. Source: BEA via ALFRED, and NBER.
Note that as of end-April, the economy looked like it was still expanding. Even after the annual benchmark revision, the gradient was still positive through Q2. It’s only after several more revisions that a downturn becomes apparent.
Now, as I have stressed (to little effect for some people), the NBER BCDC does not rely primarily on GDP for determining peak/trough dates. Rather, they place more focus on monthly indicators, most prominently employment and personal income ex-transfers. The monthly indicators are subject to less drastic revisions, but they still get revised (see this 2006 post regarding the 2001 recession). So, what we see in the monthly indicators today will not be what we see using subsequently released vintages.
More By This Author:
Inflation Breakevens and Expected Inflation: 5, 10, 30 Year HorizonsBusiness Cycle Indicators, At The Beginning Of August
The Sensitivity Of Economic Sentiment To Partisan Affiliation


Comments
Log in or sign up to join the conversation.