
The Importance Of Cash From Operations
Read on to learn about the importance of the cash from operations metric and its trend when analyzing a company. After all, it’s often more revealing than the good, ol' earnings per share (EPS).

Image Source: Pexels
First off, you might have heard cash from operations, cash flow from operations, and operating cash flow. Is there any difference between these? No, they all mean the same thing.
Cash from operations is comparable to how much you have in your bank account on the first of the month vs. the last of the month. If the amount continuously increases, or if the excess is saved or invested, you’re in a financially advantageous position.
Cash is king, as is often said in entrepreneurial circles, because it’s one of first things management discusses about their quarterly earnings, along with revenue and earnings. They detail both cash from operations and free cash flow (FCF) in the cash flow statements, but don’t necessarily mention them in the financial highlights of quarterly results.
Cash Flow Fluctuations
Many investors often look at how cash flow fluctuates over time. Cash flow fluctuation is caused by three types of cash flows:
- Cash from Operations: How much cash the company generates from its normal operations is calculated like this: Cash coming into the company minus cash going out to run the business. Think of it as “how much did it generate in its day-to-day operations?”
- Cash from Financing: When a company borrows money from their bank or issues bonds, there’s a new cash entry (positive) in its bank account. Paying down debt or distributing dividends has a negative effect on this part of the cash flow.
- Cash from Investing: This includes the company’s cash inflows and outflows from investments in the financial markets and the sale of capital assets.
Our focus today is on cash from operations.
Cash From Operations
Cash from operations gives a cold, hard picture of what’s going on in the company’s operations. It’s difficult for management to manipulate this number compared to net income. If margins are stable, cash from operations will likely follow the revenue trends.
In the graph below, you see how earnings per share (EPS), revenue, and cash from operations changed over ten years at Fortis.
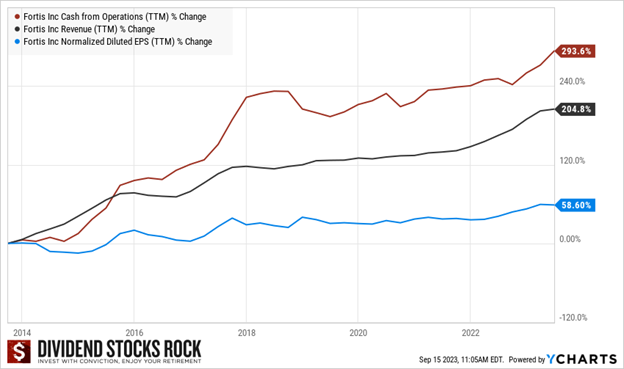
Notice how the three metrics don’t necessarily evolve in exactly the same pattern or at the same level. While changes in revenue and cash from operations are close in percentage, earnings are completely different. This is due to Fortis spending a lot of money on capital expenditures (CAPEX) and this can affect earnings, notably because amortization of capital assets hurts earnings, but not the company’s bank account.
What About Free Cash Flow?
Since companies also report free cash flow (FCF), should you look at that metric as well? FCF fluctuates a lot more than cash from operations because it includes CAPEX, which can fluctuate significantly over time. Depending on the company’s projects and how they are financed, the evolution of the FCF could be quite difficult to understand.
Depending on when you look at the FCF value, it could also be very misleading. Consider this scenario for example:
- I saved money for 12 months to take a trip.
- My free cash flow is positive for 12 consecutive months.
- If we look at my FCF the month when I go on that trip, it might be negative.
The bottom line is, I saved for 12 months and spent it all traveling. My entire project is cash flow neutral. In the graph below, we added the FCF evolution for Fortis over that same period, which formed quite an erratic-looking line.
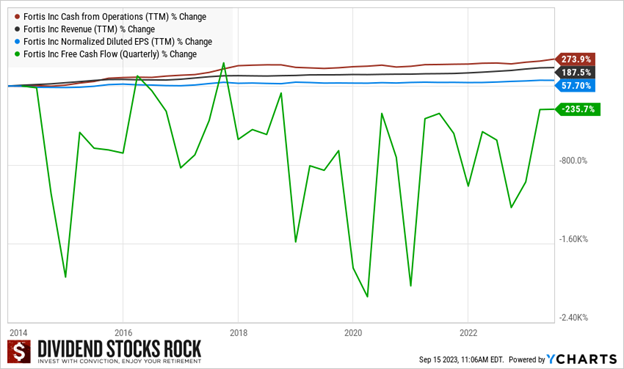
That’s why I much prefer looking at cash from operations. Constantly increasing cash from operations normally indicates a healthy company whose dividend is safe.
Calculating Cash From Operations
Here’s the simple formula to calculate cash from operations:
- Cash From Operations = Net Income + Non-Cash Items + Change in Working Capital
Net income
The Net Income is also called earnings (earnings are net income after taxes); it’s the accounting profit.
Non-Cash Items
You then add all non-cash items, such as capital appreciation or depreciation, amortization, investment gains, or investment losses, which do not involve an actual cash payment. For example, a company could report $100 million amortization on a building or a $250 million value impairment on a brand that’s not doing well. These reduce the company’s net income but don’t affect the cash in its bank account.
Change in Working Capital
You then add the change in working capital—the difference between current assets and current liabilities. This is one of main ways that cash from operations and net income differ.
When working capital decreases, i.e., the change in working capital is negative, the company might be spending to invest in current assets, or becoming less efficient, perhaps struggling to manage inventory of to collect account receivable. If the change in working capital is positive, the company might be depleting assets or becoming more efficient.
You don’t have calculate cash from operations; you can often go the company’s earnings statement to find the value. The DSR stock cards also provide the cash from operations 10-year evolution.
The Importance of Cash From Operations
What really matters is understanding that cash from operations can often tell the real story behind the company’s business model. A company could report positive earnings by being a bit loose on accounting rules, but it cannot lie if its bank account is bleeding cash.
Cash from operations is like the blood pumping through your veins. It enables all your organs to function normally, contributing to your well being. When a company is running low on cash flow, it’s missing the blood to nourish its business arms.
Next time, we will look at examples of how cash from operations can help to see a company's situation more clearly. We will also explain the role cash from operations plays in our stock analysis process.
More By This Author:
Explaining Bad Payout RatiosGenerate Enough Retirement Income From Your Portfolio
Market Review – August Dividend Income Report


