
In September 2017, I received slightly over $100K from my former employer, representing the commuted value of my pension plan. I decided to invest 100% of this money in dividend growth stocks.
Each month, I publish my results on those investments. I don’t do this to brag. I do this to show my readers that it is possible to build a lasting portfolio during all market conditions. Some months we might appear to underperform, but you must trust the process over the long term to evaluate our performance more accurately.
Performance in Review
Let’s start with the numbers as of September 5th, 2023 (before the bell):
Original amount invested in September 2017 (no additional capital added): $108,760.02.
- Portfolio value: $226,624.56
- Dividends paid: $4,545.97 (TTM)
- Average yield: 2.00%
- 2022 performance: -12.08%
- SPY= -18.17%, XIU.TO = -6.36%
- Dividend growth: +10.83%
Total return since inception (Sep 2017-August 2023): 108.37%
Annualized return (since September 2017 – 72 months): 13.02%
SPDR® S&P 500 ETF Trust (SPY) annualized return (since Sept 2017): 12.42% (total return 101.90%)
iShares S&P/TSX 60 ETF (XIU.TO) annualized return (since Sept 2017): 8.82% (total return 636.03%)
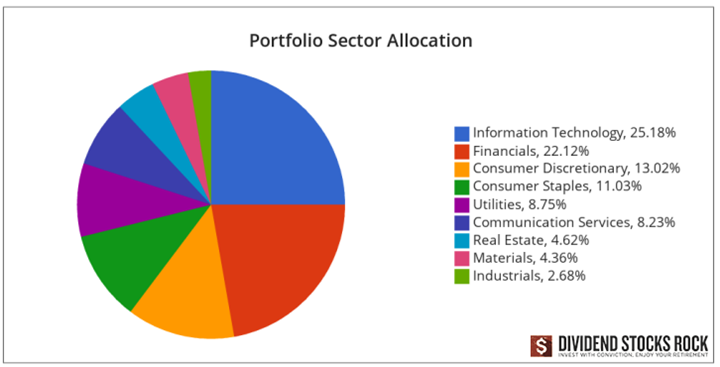
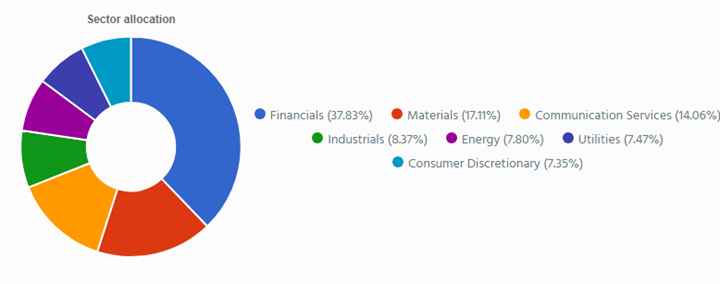
Dynamic sector allocation calculated by DSR PRO as of July 5th 2023.
Market Review
A DSR member suggested I integrate a quick market review in my portfolio update to discuss which sectors have performed well and which have underperformed year to date. I’ll cover both the U.S. market and the Canadian market.
Overall market perspective
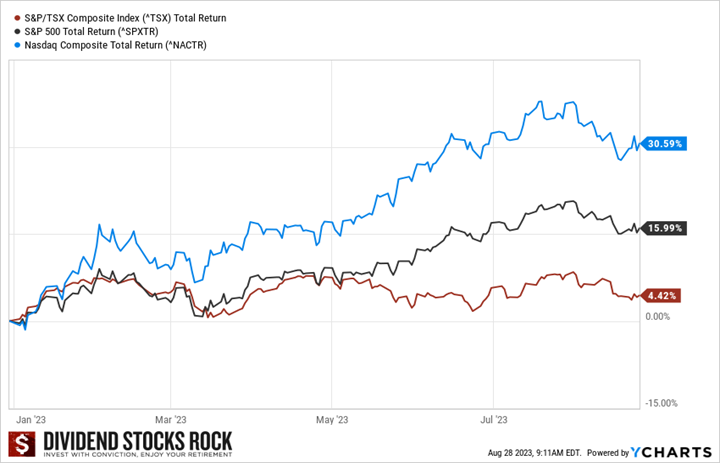
Depending on how your portfolio is built, you may be having a great year! Since my portfolio is strongly invested in technology stocks, I benefited from good support from Microsoft (MSFT), Apple (AAPL), and Constellation Software (CSU.TO). Unfortunately, not all tech stocks are thriving as my shares of Texas Instruments (TXN) are up by only ~4% since the beginning of the year (including dividends!).
This graph also shows the importance of diversification. While last year was all about oil & gas, this year is all about tech stocks and the U.S. market rebound. If you are heavily invested in Canadian banks, REITs, and utilities, you are not experiencing the best of times this year.
What’s coming this fall?
Summer is about to end in a few weeks and our eyes are glued to the central banks’ pending decisions. Both the Fed and the Bank of Canada made it clear that more interest rate hikes are coming. How much? Probably something around 50 to 75 basis points more. Obviously, this is my wild guess, and the economic situation could turn on a dime. The main message remains though: as long as the inflation rate is not back down to 2%, you will hear about interest hikes.
When I look at all the dark clouds gathering over our heads, I’m currently bracing for impact. I don’t think we will have a great fall in terms of stock returns. We have been receiving lots of signals as of late:
- Railroads show a slowdown in revenues.
- Tech stocks have mentioned that their clients are tightening their budgets.
- Retailers are highlighting consumers’ focus on essential goods and reducing their discretionary expenses.
- Banks are continuing to raise their provision for credit losses.
- Central banks keep pushing rates higher.
Does it smell of recession? I think so.
What can you do? Not much besides making sure you have more “core holdings” than “educated guess and speculative plays” in your portfolio.
Why? Because I could be wrong, you could be wrong, or we could both be right, but the market might decide to go up anyway! I know, it’s confusing. That’s why I don’t try to time the market.
The second investors believe interest rate hikes are over, we will see stock prices going up. Remember, there is always a difference between the stock market trend and the economic data you read. One is looking forward while the latter is looking backward. I know, again it’s confusing.
I finished my portfolio spring clean-up at the beginning of the year. Therefore, I don’t intend to make any major modifications to my portfolio at this point. During the first three months of 2023, I sold my shares of Algonquin (AQN.TO), VF Corporation (VFC) and Enbridge (ENB.TO). Sadly, I only made a profit on ENB. It was more important to me to strengthen my portfolio for the future than keeping and hoping those stocks would recover.
I’ve mentioned it several times before; hoping is not a successful investment strategy.
Now that my portfolio is mostly invested in strong dividend growers, I can sit back, relax, and watch the stock market show!
Let’s take a look at how both markets (US and Canadian) have performed per sector.
U.S. market review: Meta’s revenge
(Click on image to enlarge)
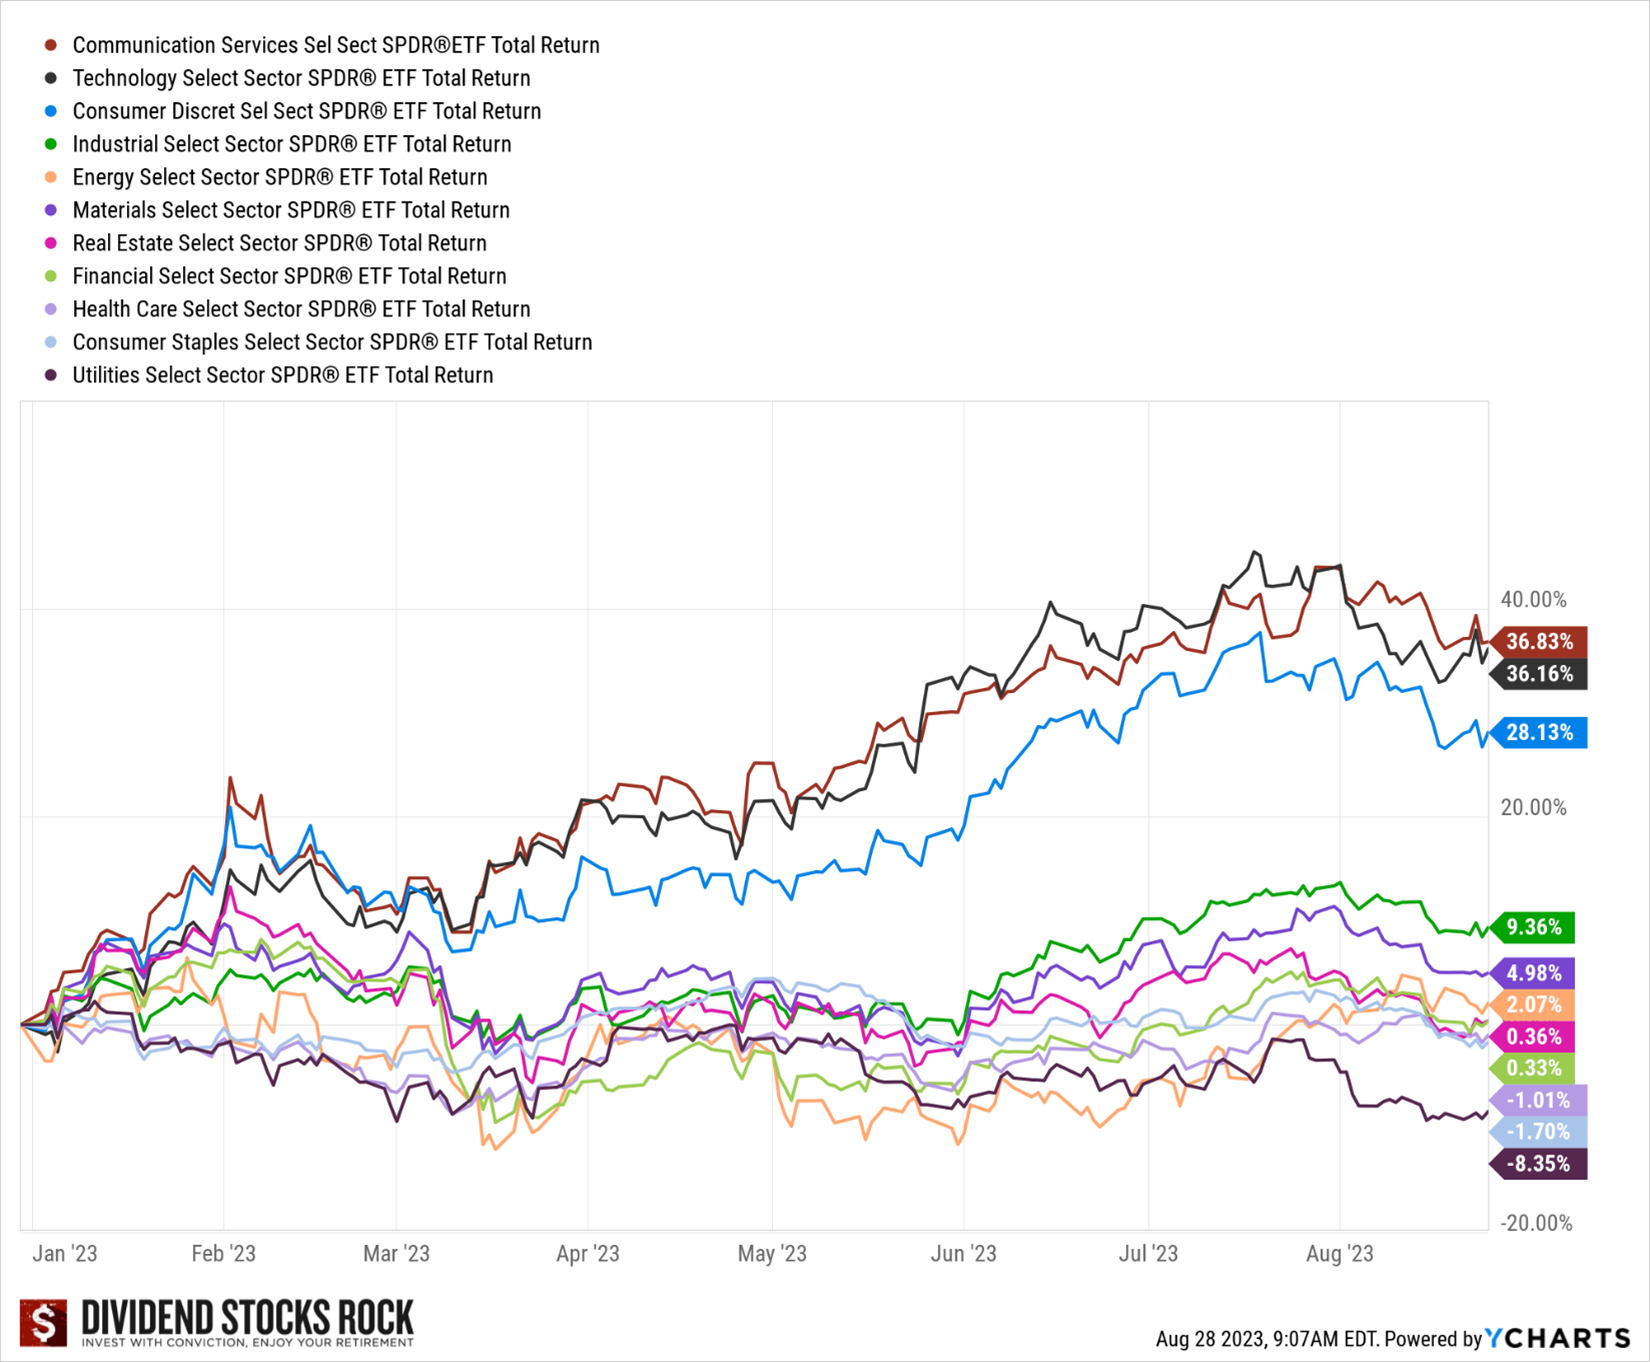
When I pulled the sector performance data, I was shocked to see that communication services was the best-performing sector in the U.S. How did Verizon, AT&T and Disney pull out such performance without me noticing? Short answer: they didn’t!
This is a great example of understanding how sectors are built and what they represent. When I think about communication services, I mostly think about wireless, media and cable providers. But today, we include “tech stocks” such as Meta (META) and Alphabet (GOOGL). Unfortunately, the ETF I use in this graph (XLC) includes a 50% weight into Meta and Alphabet. Not a good way to look at this sector!
After getting killed in the market in 2022, META is back with revenge. The stock more than doubled this year. Alphabet? Almost up 50%! What about AT&T and Verizon? They are both suffering and down double-digits. Don’t even get me started on Disney. It is becoming a real dog in my portfolio! Fortunately, I cashed a nice profit on my Activision Blizzard ATVI trade this summer! If you are a dividend growth investor, the communication services sector has not performed well.
When we look at the top three best-performing sectors in the U.S., we see that it’s simply the market wave making its work. Last year, those three sectors were hurt significantly. They went down too fast and now they are recovering a part of their losses.
At the end of the spectrum, we see Health Care, Consumer Staples, and Utilities. Surprisingly, REITS and financial services are not in negative territory. They should have been hurt due to higher interest rates and the risk of falling into a recession.
The Health Care and Consumer Staples sectors had a nice run over the past few years, and it only makes sense to see some investors cashing in on their profits. Plus, there were great expectations around all COVID-19 drugs. It seems this growth chapter is closed for now.
Utilities are facing multiple headwinds at the same time. Regulators are tougher on rate increases as they consider consumers’ ability to pay their bills. On the other side, higher interest rates weigh on utilities’ balance sheets and drive income-seeking investors away from them as they prefer investing in bonds at these rates. While many utility stocks thrived in a low-interest rate environment, most of them will get back to their original function in a portfolio: a stable and boring dividend payer. It’s not a bad thing, but just don’t expect double-digit returns year after year from this sector going forward.
What’s new in maple syrup country?
When we look at the Canadian market, the BMO communication and consumer discretionary ETFs include U.S. stocks. Therefore, you’ll see them as best performers, but they are not telling a Canadian story. While we still count many oil & gas bulls, we can see that this sector has performed in line with the TSX composite so far this year (up around 4-5%). If we head into a recession demand for energy will slow down (the oil barrel isn’t at $100 anymore) and this could weigh on many energy stocks.
It is a rare occasion when the Canadian banks struggle to beat the overall market. In fact, they even show sign of weakness! I don’t expect banks to recover before the end of the year. I think it will get worse before it gets better. Once we are done with interest rate hikes, my money will be on banks to go up quickly. Let’s hope they remain conservative and their provisions for credit losses (PCLs) appear to be too much. Next year, this could support a nice round of EPS growth as PCLs are turned into profit as the loan are repaid. Finally, look at TD’s announcement of a 5% share buyback program which shows confidence from management as they tell us they believe TD shares should trade higher soon.
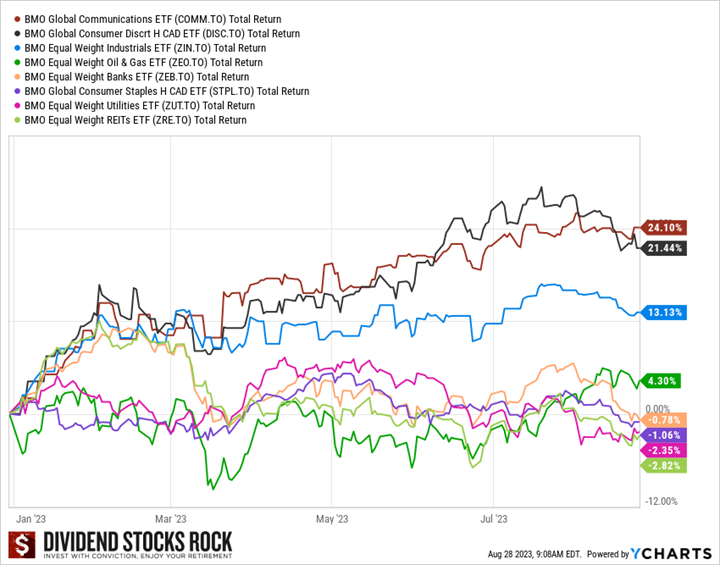
Similar to what we see in the U.S., utilities and REITs aren’t performing well. There are many concerns around REITs, especially in the office and retail industries. Who wants to rent hundreds of thousands of square feet in downtown Toronto while all your employees want to work from home?
We have seen a negative trend in the occupation rate and no sign of recovery yet. This is clearly a big concern. It’s either an amazing investment opportunity or a huge risk to take. AS you know, high risk, high reward. But that’s just potential… because it could also mean high risk, high losses…
Speaking of risks, let’s take a look at my leverage portfolio!
Smith Manoeuvre Update
Slowly but surely, the portfolio is taking shape with 9 companies spread across 7 sectors. My goal is to build a portfolio generating 4-5% in yield across 15 positions. I will continue to add new stock monthly until I reach that goal. My current yield is at 4.66%.
Paying off my margin account
As you know I’ve been using the margin account to accelerate my investments. Since I already boosted my positions in Nutrien, Telus and TD, I decided to use my next $500 to pay back most of the money borrowed on this account. Paying interest on money owed is only a good strategy over a short period of time!
I’ll have another transaction completed in October!
Here’s my SM portfolio as of September 5th, 2023 (before the bell):
| Company Name | Ticker | Sector | Market Value |
| Brookfield Infrastructure | BIPC.TO | Utilities | $469.44 |
| Canadian National Resources | CNQ.TO | Energy | $529.98 |
| Canadian Tire | CTA.A.TO | Consumer Disc. | $478.44 |
| Exchange Income | EIF.TO | Industrials | $531.74 |
| Great-West Lifeco | GWO.TO | Financials | $670.99 |
| National Bank | NA.TO | Financials | $569.28 |
| Nutrien | NTR.TO | Materials | $1,141.92 |
| Telus | T.TO | Communications | $904.78 |
| TD Bank | TD.TO | Financials | $1,165.78 |
| Cash (Margin) | -$82.63 | ||
| Total | $6,379.72 | ||
| Amount borrowed | -$6,000.00 |
Let’s look at my CDN portfolio. Numbers are as of September 5th, 2023 (before the bell):
Canadian Portfolio (CAD)
| Company Name | Ticker | Sector | Market Value |
| Alimentation Couche-Tard | ATD.B.TO | Cons. Staples | $25,988.01 |
| Brookfield Renewable | BEPC.TO | Utilities | $8,499.86 |
| CAE | CAE.TO | Industrials | $6,588.00 |
| CCL Industries | CCL.B.TO | Materials | $8,517.60 |
| Fortis | FTS.TO | Utilities | $9,131.40 |
| Granite REIT | GRT.UN.TO | Real Estate | $9,747.20 |
| Magna International | MG.TO | Cons. Discre. | $5,611.90 |
| National Bank | NA.TO | Financials | $11,480.48 |
| Royal Bank | RY.TO | Financial | $7,985.25 |
| Cash | $1,022.26 | ||
| Total | $94,571.96 |
My account shows a variation of -$167.08 (flat%) since the last income report on August 10th.
All companies but Alimentation Couche-Tard (they are always late!) have reported their earnings for the quarter. Let’s take a look!
Brookfield Renewable generates constant FFO per share growth
Brookfield Renewable reported a good quarter with FFO per share up 4.3% for this quarter and up 10% year-to-date. Their liquidity position remains robust with over $4.5 billion of total available liquidity providing significant flexibility to fund growth, and no meaningful near-term maturities. BEP signed transactions for $1.3 billion of equity investment ($300 million net to Brookfield Renewable) alongside its institutional partners. It also continued to advance development activities, and commissioning approximately 1,500 megawatts of capacity year to date. Management remains focused on delivering 12-15% annual long-term total returns for investors.
CAE is flying!
CAE reported a strong quarter as revenue jumped by 13% and EPS surged from $0.06 to $0.24 this quarter (where is the dividend?). While the dividend triangle is getting stronger (revenue and EPS growth trend), there is no sign a dividend will be reinstated. Both segments (civil aviation and defense and security) saw their revenues increase by double-digits (+13 and +14%, respectively).Civil signed training solutions contracts valued at $730.2 million, including a range of long-term commercial and business aviation training agreements and 22 FFS sales. Defense booked orders for $237.7M and an additional $779.0M of unfunded contracts this quarter.
CCL Industries didn’t impress
CCL Industries reported an okay quarter as revenue increased by 2%, but EPS decreased by 4%. CCL reported an organic decline of 4.5%, offset by acquisition-related growth of 1.0% and a 5.3% positive impact from foreign currency translation. The company saw organic growth at Avery and Checkpoint, but CCL segment sales decreased by 3% as demand weakened.Here’s another sign that the economy is slowing down! Operating income for the 2022 second quarter included a $3.5 million non-cash acquisition accounting adjustment related to the acquired inventory from the Adelbras acquisition.
Fortis like clockwork
While Fortis’ share price declined, the company reported a solid quarter with revenue up 4% and EPS up 9%. The increase primarily reflected rate base growth, largely at ITC and the western Canadian utilities. Also contributing to earnings growth was the timing of operating expenses at Central Hudson and FortisAlberta, an increase in the market value of certain investments that support retirement benefits, and a higher U.S.-to-Canadian dollar foreign exchange rate. The utility invested $2B in CAPEX during the first half of the year and it is on track to complete its $4.3B CAPEX plan for the year.
Granite REIT keeps up with rock solid results
Granite reported another solid quarter with revenue up 19% and FFO per unit up 5%. Growth was supported by net acquisition activity, the completion of developments and expansions beginning in the second quarter of 2022, and contractual rent adjustments. Same property NOI increased by 7.7% for the second quarter of 2023, excluding the impact of foreign exchange.The Canadian dollar weakened against the US dollar and the Euro relative to the prior year period. It had an impact of $0.06 on the FFO per share. Nonetheless, the distribution remains safe with an AFFO payout ratio of 73% (vs 75% last year).
Magna International impresses with swift action!
Magna International reported better than expected results. Sales increased 17% to $11.0B during the quarter, which was a stronger pace of sales growth than the 15% increase in global light vehicle production during the quarter.The company’s focus on operational excellence and cost initiatives was said to have helped drive strong earnings on higher sales. The EBIT increase was also noted to reflect losses in the Russian facilities during the second quarter of 2022. Looking ahead, Magna sees full-year sales of $41.9B to $43.5B. We have increased our rating from 3 to 4 as Magna management has taken swift action to bring the company back on track.
National Bank tumbles
It wasn’t National Bank’s best quarter as net income dropped by 4% and EPS dropped by 6%. Revenue growth in all of the business segments, aside from the Financial Markets segment, was partly offset by higher provisions for credit losses. P&C net income +3%, driven by growth in total revenues, tempered by higher non-interest expenses and higher provisions for credit losses. Wealth management +5%, driven by growth in net interest income and fee-based revenues. Financial markets -27%, hurt by higher PCLs. U.S. & Intl +2% as PCLs remained stable. We often mention that financial markets could save or kill the day…
Royal Bank is a beast for tax optimization
Royal Bank reported higher PCL this quarter, but surprised us with double-digit net income and EPS growth (+11%). Results were mainly due to lower taxes, higher revenue in Capital Markets reflecting higher revenue in Corporate and Investment Banking including the impact of loan underwriting markdowns in the prior period as well as in Global Markets. Higher net interest income driven by higher interest rates and strong volume growth in Canadian Banking also contributed to the increase. By segment: P&C net income was up 5%, Wealth Management -18% (investment in City National + higher PCL), Insurance +22% (investment performance), Capital markets +57% as explained above.
I have reviewed all Canadian Banks latest earnings in the video below:
Here’s my US portfolio now. Numbers are as of September 5th, 2023 (before the bell):
U.S. Portfolio (USD)
| Company Name | Ticker | Sector | Market Value |
| Apple | AAPL | Inf. Technology | $14,209.50 |
| BlackRock | BLK | Financials | $9,886.66 |
| Brookfield Corp. | BN | Financials | $11,895.24 |
| Disney | DIS | Communications | $3,673.80 |
| Home Depot | HD | Cons. Discret. | $9,992.40 |
| Microsoft | MSFT | Inf. Technology | $18,076.30 |
| Starbucks | SBUX | Cons. Discret. | $8,330.00 |
| Texas Instruments | TXN | Inf. Technology | $8,491.50 |
| Visa | V | Inf. Technology | $12,405.50 |
| Cash | $156.96 | ||
| Total | $97,117.86 |
My account shows a variation of +$1,189.91 (+1.24%) since the last income report on August 10th.
All companies have reported their earnings for the quarter. Let’s take a look!
Apple is still a cash flow machine
Apple reported an okay quarter as sales declined by 1.4%, but EPS were up 5%.The company generated $39.7B in iPhone-related revenue, while iPad and Services came in at $5.8 and $21.2B, respectively. Wearable, Home and Accessories revenue clocked in at $8.28B, compared to $8.08B in the year-ago quarter. Mac sales dipped 7.3% year-over-year to $6.8B. Sales were lower in North America (-5.6%) but better in China (+7.9%). While Apple is going through a slowdown in its business, it’s still a massive cash flow generator. It generated $26B in operating cash flow and returned $24B to its shareholders through dividends and share buybacks.
BlackRock is doing okay
BlackRock reported a mixed quarter as revenue declined by 1%, but EPS surged by 26%. Overall, results were better than expected as revenue from investment advisory, administration fees, and securities lending increased from Q1 levels and net inflows remained positive. Long-term quarterly net inflows were $80B with positive flows across client types and regions vs. $103B in the previous quarter. ETF flows were $48B, rising from $22B in the previous quarter. Assets under management increased to $9.43T from $9.09T. The decrease of 1% in revenue was mostly driven by the impact of market movements over the past 12 months on average AUM.
Brookfield Corp. is ready to invest more
Brookfield Corporation reported a good quarter as many segments participated in the growth. The asset management business benefited from another strong quarter of fundraising and deployment, increasing fee-related earnings by 16%, when excluding performance fees, compared to the prior year. The insurance solutions segment is on track to achieve annualized earnings from this business of $800 million by the end of 2023, with a further step change in earnings expected from the closings of Argo Group and the recently announced acquisition of American Equity Life. BN ended the quarter with $120B in liquidity ready to jump on the next opportunity!
Disney is no fairy tale
It’s a tough year to be a Disney shareholder! The company reported mediocre revenue growth (+4%) while EPS declined by 5%. All eyes are on DIS’ streaming services. Domestic Disney+ average monthly revenue per paid subscriber increased from $7.14 to $7.31 due to higher per-subscriber advertising revenue. Disney remains in the middle of a major restructuring and there are many unanswered questions. While the company generated strong revenue growth from its Parks segment, DIS continues to lose money in its Direct-to-Consumer segment (streaming services). The situation is getting better, but there is a long path ahead and investors are losing patience.
Home Depot warns us about what’s coming
Home Depot did better than expected despite weaker revenue (-2%) and earnings (-7.9%). Comparable sales also fell 2%, customer transactions were down 1.8% and the average transaction ticket rose 0.1%. The company’s inventory position at the end of the quarter was $23.27B vs. $26.09B a year ago. The company also reaffirmed its 2023 guidance: Sales and comparable sales to decline between 2% and 5% and EPS are expected to decline by 7% to 13%.While share prices go sideways, the board authorized a new $15B share repurchase program for 2023 replacing its previous authorization. This action should add value to shareholders over the long haul.
Microsoft is well… Microsoft!
Microsoft reported another solid quarter with revenue up 8% and EPS up 21% beating analysts’ expectations. The Productivity and Business Processes segment was up 10% driven by Office Commercial products. Intelligent Cloud revenue was up 15% driven by Azure (+27%). Revenue growth was partially offset by More Personal Computing which declined by 4% mostly driven by weaker Windows sales (-12%) and devices sales (-20%). Management is optimistic for the coming quarters as MSFT focuses on AI workloads in the cloud which support strong demand going forward.
Starbucks is pouring great results
Starbucks reported a good quarter with revenue up 13% and EPS up 15%. Average ticket sales were up 4% and transactions were up 5% during the quarter. Inflation is clearly not a factor for those who want their Caramel Macchiato! Comparable sales in North America increased 7%, driven by a 6% increase in average ticket and 1% rise in comparable transactions. International comparable sales rose 24% during the quarter vs. +24.2% consensus. China comparable store sales increased 46% vs. the consensus estimate for a 42% increase. Active membership in Starbucks Rewards in the U.S. rose 15% to 31.4M. Finally, SBUX opened 588 net new stores during the quarter.
Texas Instruments’ dividend triangle softens
Texas Instruments continues to face weak demand as customers reduce their inventory across most industries besides automotive. This resulted in a revenue decline of 13% and EPS reduction of 34%. As the dividend triangle is softening, TXN issued lower guidance for the full year of 2023. It now expects to earn between $1.68 and $1.92 per share in Q3. The midpoint of that is $1.80, significantly below the consensus EPS estimate of $1.91. TI anticipates Q3 revenue to be in the range of $4.36B to $4.74B, the midpoint of which is $4.55B. The consensus revenue estimate is $4.59B.
Visa surfs on consumer spending and travelling
Visa reported another strong quarter with revenue up 12% and EPS up 9%. Surprisingly, consumer spending continues to drive volume and total transactions up! Payment’s volume in the quarter rose 9% Y/Y in constant dollars with cross-border volume up 17% and processed transactions up 10%. That compares with Q2 payments volume growth rate of 10%, cross-border volume up 24%, and processed transaction increase of 12%. Cross-border volume excluding transactions within Europe, which drive international transaction revenues, increased 22%. People continue to travel!
My Entire Portfolio Updated for Q2 2023
Each quarter we run an exclusive report for Dividend Stocks Rock (DSR) members who subscribe to our very special additional service called DSR PRO. The PRO report includes a summary of each company’s earnings report for the period. We have been doing this for an entire year now and I wanted to share my own DSR PRO report for this portfolio. You can download the full PDF showing all the information about all my holdings. Results have been updated as of July 5th, 2023.
Dividend Income: $415.34 CAD (Flat vs. August 2022)
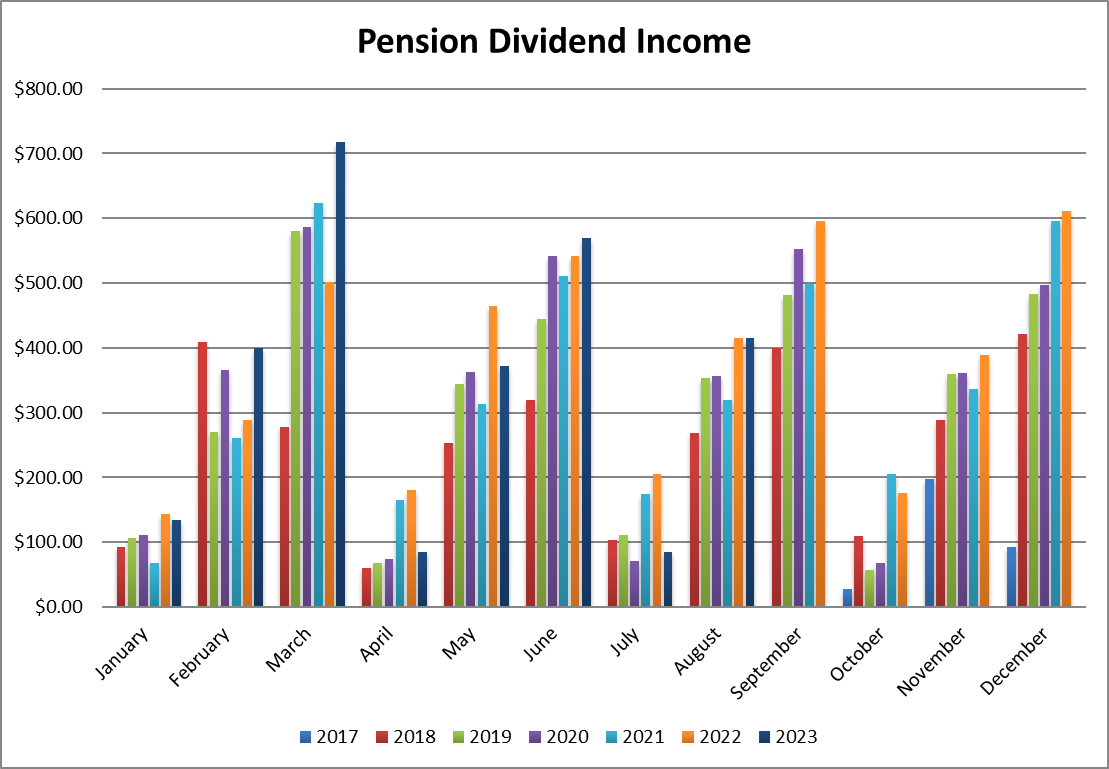
Dividends paid in August were essentially flat vs. last year mostly because Magna International paid me on September 1st this year, but the payment was recorded in August last year. Therefore, you can expect a higher dividend payment for September!
All holdings paying dividends this month were more generous than last year. It resulted in a larger cash balance in my Canadian account (roughly $1,000). I’ll be using this money to reinvest in my portfolio during September.
Here are the details of my dividend payments.
Dividend growth (over the past 12 months):
- National Bank: +10.87%
- Granite: +3.27%
- Royal Bank: +14.26%
- Texas Instruments: +7.83%
- Apple: +4.35%
- Starbucks: +8.16%
- Currency: +4.41%
Canadian Holding payouts: $245.31 CAD.
- National Bank: $123.42
- Granite: $34.14
- Royal Bank: $87.75
U.S. Holding payouts: $125.05 USD.
- Texas Instruments: $62.00
- Apple: $18.00
- Starbucks: $45.05
Total payouts: $415.34 CAD.
*I used a USD/CAD conversion rate of 1.3597
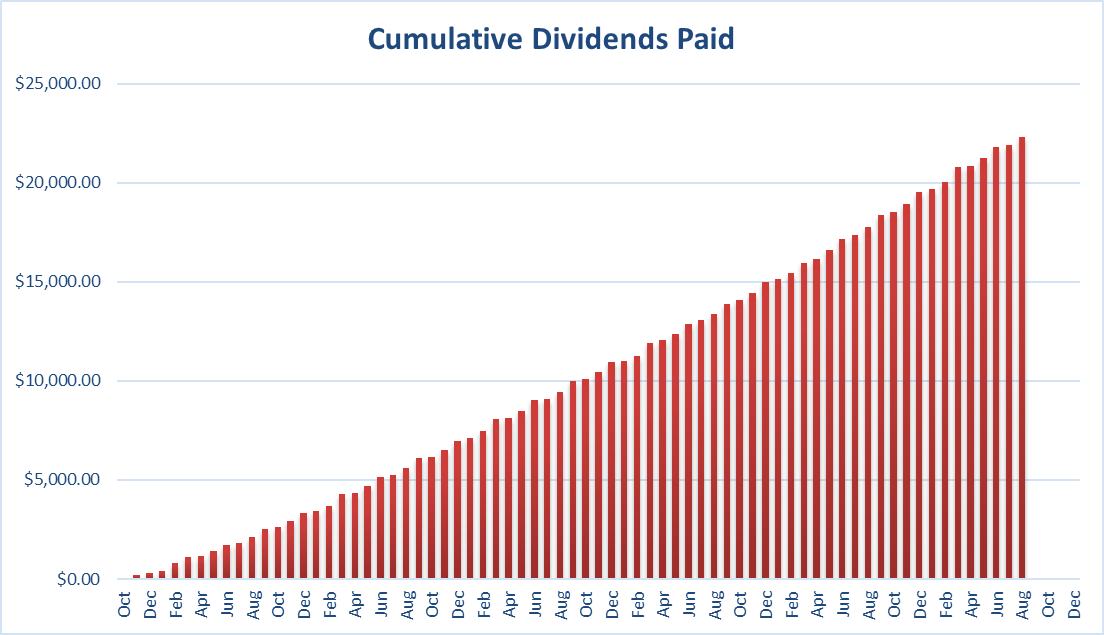
Since I started this portfolio in September 2017, I have received a total of $22,298.11 CAD in dividends. Keep in mind that this is a “pure dividend growth portfolio” as no capital can be added to this account other than retained and/or reinvested dividends. Therefore, all dividend growth is coming from the stocks and not from any additional capital being added to the account.
Final Thoughts
As I mentioned at the beginning of this newsletter, right now is not the time to take wild guesses. I expect the fall will be rough, but I hope I’m wrong!
Either way, if you are well-invested, you shouldn’t have to worry about anything. Your dividends should be paid and your retirement plan is well on track.
More By This Author:
Retirement Withdrawal Strategy: Avoid Panic, Enjoy Life
Do Down Markets Affect Retirement?
What Makes A Hold-Forever-Stock


Comments
Log in or sign up to join the conversation.