
Explaining Bad Payout Ratios

Image Source: Unsplash
Why bother explaining bad payout ratios? After all, it’s pretty simple: dividend payout ratios over 100 or below zero are bad, right? Not necessarily. When assessing whether a company can afford to pay its dividend, viewing all negative payout ratios and those over 100% as bad might help to keep things simple, but it is often wrong. Let’s have a closer look.
First, the classic dividend payout ratio formula looks like this:
- Dividend paid per share ÷ Earnings per share (EPS) * 100
Another useful metric is the Cash Payout Ratio. It shows if a company generates enough cash from its operations to cover its dividend rather than using accounting earnings (EPS) as seen in the classic ratio.
A classic payout ratio above 100% shows the company paid more in dividends than it made in profit. A company with a negative payout ratio has lost money, i.e., its EPS is negative. At first glance, both scenarios point to a dividend that is not sustainable and could be at risk.
This could be true, or not. It depends on the context in which the so-called bad payout ratio occurs. Automatically discarding companies showing a payout ratio over 100% as possible investments is a mistake.
What’s a Good Payout Ratio?
Generally, a payout ratio under 80% gives a company enough flexibility to pursue its growth while increasing its dividend annually. This is true as long as the company grows its revenue and earnings consistently.
A “good” payout ratio has a lot to do with the company’s performance versus its industry. For example, most Canadian banks target a payout ratio in the 45%-50% range, with a similar trend seen among utilities. Other industries gravitate to lower or higher ratios.
Many tech companies keep very low payout ratios because they focus on growing their business rather than distributing most of their earnings to shareholders. This can be seen with, for example, Apple's (AAPL) payout ratio of 15% and dividend yield of 0.5%, as well as Microsoft’s (MSFT) payout ratio of 28% and yield of 0.8%.
Other companies’ payout ratio follows economic cycles while they continuously increase their dividend. 3M (MMM) has increased its dividend every year since 1959. However, its payout ratio varies, rising to the 75%-80% range during economic slowdowns.
Explaining Payout Ratios >100%
There are acceptable reasons for a company to pay more in dividends than it earns in profit. For example, a temporary setback or a one-time event not likely to occur again such as a product recall, a lawsuit settlement, or a natural disaster affecting production capacity.
The payout ratio depicts a company’s financial situation; that picture can change quickly. For example, take a look at Starbucks' (SBUX) usual <50% payout ratio jump to 296% almost overnight.
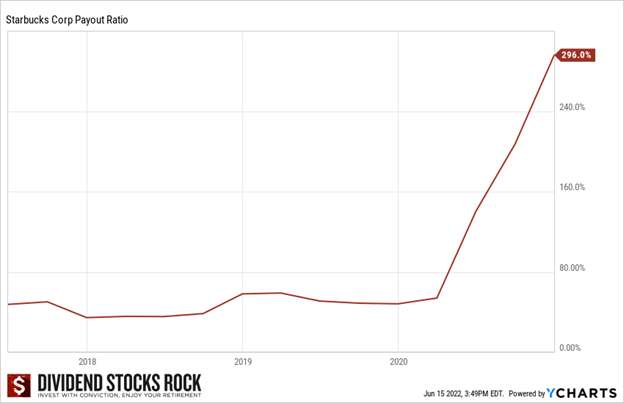
If this was my first look at Starbucks, I’d be alarmed. However, looking at context and recent quarterly reports reveal it was an anomaly. It happened because Starbucks closed many restaurants during the pandemic lockdown.
Obviously, this is still a red flag; Starbucks couldn’t sustain this level of operations long-term. Was the dividend at risk, though? Looking at the payout ratio exclusively, one could conclude it was about to be cut. Examining the context and how the company is managed showed that although possible, a dividend reduction was unlikely, and most likely temporary.
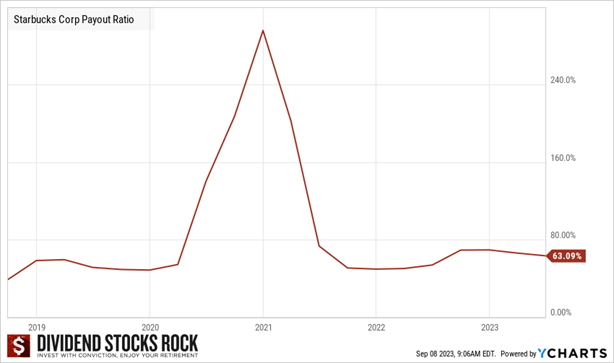
Starbucks subsequently reopened restaurants and its payout ratio went back to normal rapidly. See how quickly a bad year can push the payout ratio above 100%?
What about a consistently high payout ratio? How can Enbridge (ENB) keep increasing its dividend while maintaining a payout ratio above 100%?
Enbridge’s payout ratio has been above 100% since 2017. The one-time or temporary event explanation falls apart here. What if I told you that Enbridge’s “real” payout ratio is around 65-70%?
Classic payout ratio calculation uses EPS. EPS calculation includes non-cash items, like depreciation and amortization, as well as capital expenditures (CAPEX). Non-cash items don’t affect the amount of cash available to pay dividends, nor CAPEX fund infrastructure projects that are expected to generate new revenue and profit in the future.
Enbridge’s EPS is often distorted due to its heavy non-cash items and CAPEX. Its quarterly presentation explained it uses distributable cash flow (DCF) per share to calculate its payout ratio rather than EPS for that very reason. Using DCF/share, you get a payout ratio of 64.74% for Q2’23.
You should still pay attention to high payout ratios. Capital-intensive companies like pipelines, telecoms, utilities, industrials, etc., are vulnerable to interest rates pressuring their debt cost each quarter. Sooner or later, they have to pay down their debt.
Whenever you see a payout ratio above 100%, review the company’s business model and look at the quarterly earnings. I’d say a payout ratio over 100% is not sustainable when it remains there for a long time and the company lacks the ability to grow its revenue and earnings in the future. Some of our other writing shows how the payout ratio fits in with all other criteria when choosing stocks.
Explaining Negative Payout Ratios
A negative classic payout ratio happens when a company is losing money, i.e., when the EPS used to calculate the payout ratio is negative. The company uses debt to pay its dividend.
This is often caused by a one-time charge that hurt earnings, such as a real money or an accounting impairment, e.g., value adjustment of assets such as property. If you find the cause and see that it will be resolved, don’t pay much attention to the negative ratio.
For example, 3M’s earnings were negative in the quarter when it settled an expensive lawsuit. Technically, 3M couldn’t afford to pay a dividend that quarter as it paid that huge bill, but it chose to not suspend its dividend for this one-time event.
Recap: Investigate Bad Payout Ratios
The payout ratio is an indicator of dividend sustainability, but it’s not the only one. Always combine the payout ratio analysis with the dividend triangle. Doing this for 3M reveals that, although it suffered a one-time charge for the lawsuit, it’s also facing other headwinds: declining revenues and EPS trends, and dividend growth seriously slowing down.
Investigate “bad” payout ratios to understand their context. Look at the trend over several quarters, and five to 10 years, to see whether it’s an anomaly. Then, dig into the quarterly reports to find the reason. That’s using the payout ratio wisely.
More By This Author:
Generate Enough Retirement Income From Your PortfolioMarket Review – August Dividend Income Report
Retirement Withdrawal Strategy: Avoid Panic, Enjoy Life


