S&P U.S. Indices Year-End 2022: Analyzing Relative Returns To CRSP
The S&P U.S. Equity Indices aim to represent and measure the performance of distinct market cap segments of the investable U.S. equity market. The S&P Composite 1500®, which consists of the S&P 500®, S&P MidCap 400®, and S&P SmallCap 600®, is constructed differently compared to other indices with similar objectives. These nuances can impact index characteristics and help to explain differences in performance.
Exhibit 1 shows the performance of these indices against their CRSP counterparts. S&P U.S. Equity Indices typically outperformed over distinct time horizons, and they outperformed across the cap spectrum in 2022, continuing the positive mid-year trend.

In 2022, the mid-and mid/small-cap segment showed the strongest outperformance numbers: the S&P MidCap 400 and S&P 1000 indices outperformed their CRSP counterparts by 5.62% and 4.26%, respectively, the second-largest calendar year outperformance figures since 2016. Differences in sector exposures were useful in explaining relative returns last year.
For example, Exhibit 2 shows the attribution analysis of the S&P MidCap 400 against the CRSP U.S. Mid Cap Index. The analysis assesses the portion of S&P 400® relative returns in 2022 that came from differences in GICS® sector exposures (allocation effect) versus the choice of companies in each sector (selection effect). A key takeaway from Exhibit 2 is that while the S&P 400 benefited from having less exposure to IT, which underperformed, the choice of companies in the sector (selection effect) had an even greater impact. Similar results were observed across the cap spectrum in 2022.

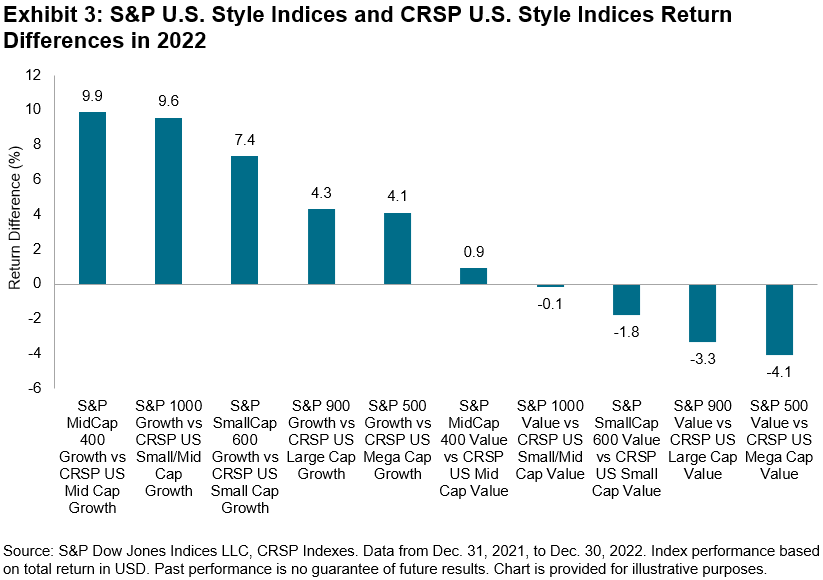
The S&P U.S. Core Indices’ 2022 outperformance drove the S&P U.S. Growth Indices’ relative returns versus CRSP growth indices. Exhibit 3 shows that the S&P U.S. Growth Indices outperformed their CRSP growth counterparts across the market cap spectrum, with the S&P MidCap 400 Growth (9.9%) and S&P 1000 Growth (9.6%) indices recording their second-largest outperformance rates since 2016. S&P U.S. Value Indices generally underperformed, although the S&P MidCap 400 Value slightly outperformed the CRSP U.S. Mid Cap Value Index, by 0.9%.

Performance attribution analysis shows that the allocation and selection effects in 2022 were positive for the S&P U.S. Growth Indices (see Exhibit 4). The S&P Growth Indices benefited from less exposure to sectors like IT and more to Energy, as well as the choice of constituents in Financials and IT. The opposite was true for S&P Value Indices, which were particularly hindered by having less exposure to some of the best-performing sectors like Energy. Although sector exposures were a drag, the choice of companies in some sectors like Financials and Consumer Discretionary helped to mitigate some of the negative performance.

Despite a challenging 2022 for the U.S. equity market, S&P U.S. Core Indices outperformed CRSP core indices. Differences in index construction that determine sector exposures and the selection of companies were helpful in explaining relative returns. Similarly, S&P Style Indices’ relative returns versus their CRSP counterparts also highlighted that index construction matters. Indices with similar objectives can behave differently, especially over shorter time periods.
More By This Author:
Expanding The Dividend Aristocrats Ecosystem With ESG Screening And FMC Weighting
International Women’s Day Embraces Equity
S&P U.S. Indices Year-End 2022: Analyzing Relative Returns To Russell
Disclaimer: See the full disclaimer for S&P Dow Jones Indices here.


