S&P U.S. Indices Year-End 2022: Analyzing Relative Returns To Russell
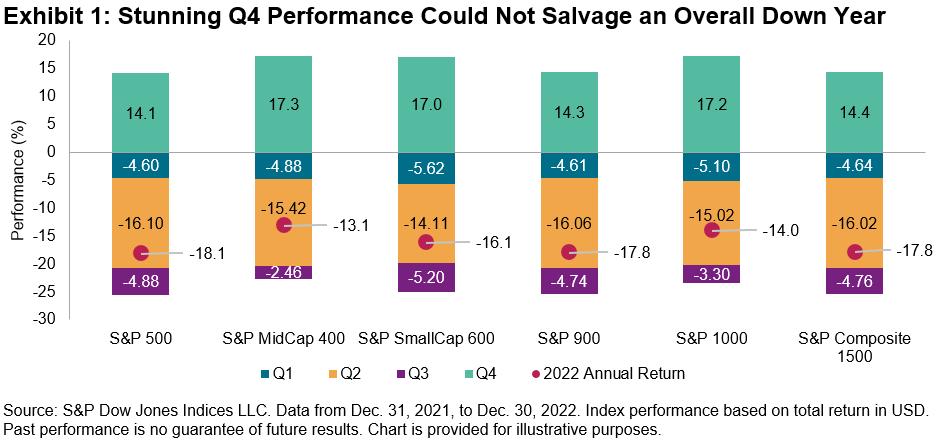
2022 was a challenging year across asset classes, including equities. Exhibit 1 shows that there were declines across the U.S. equities market cap spectrum. For example, the S&P 500® fell 18% for the whole year; the gains in the fourth quarter were not sufficient to overcome the declines during the first three quarters.
(Click on image to enlarge)
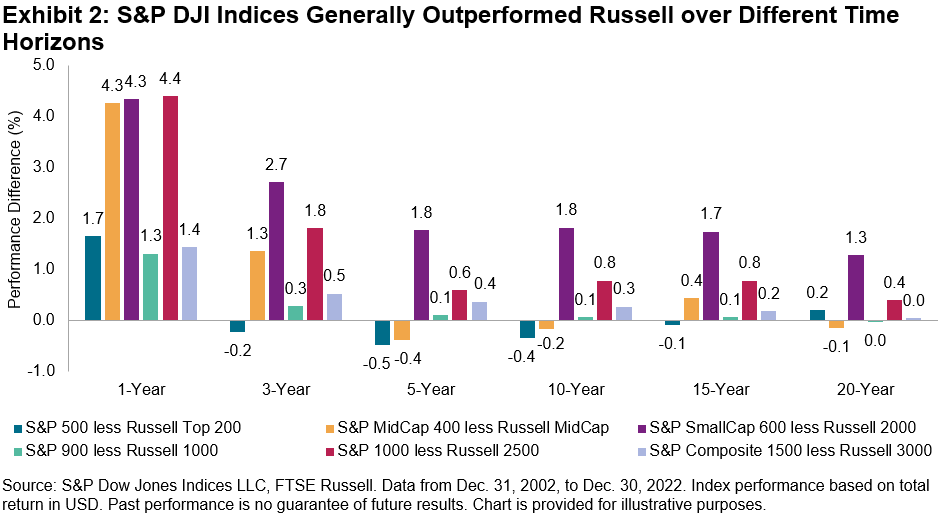
Amid the turbulent environment, S&P DJI’s U.S. equity indices fared well relative to their Russell counterparts, generally outperforming in most months over the past year. For instance, the S&P 500 outperformed the Russell Top 200 by 1.7% in 2022, its largest margin since 2011. The S&P SmallCap 600® outperformed the Russell 2000 by 4.3%, far above its average annual outperformance since 1995 (1.7%), and the S&P 900 and S&P Composite 1500® outperformed their Russell counterparts by 1.3% and 1.4%, respectively, both the third-highest margins since 1996.
(Click on image to enlarge)
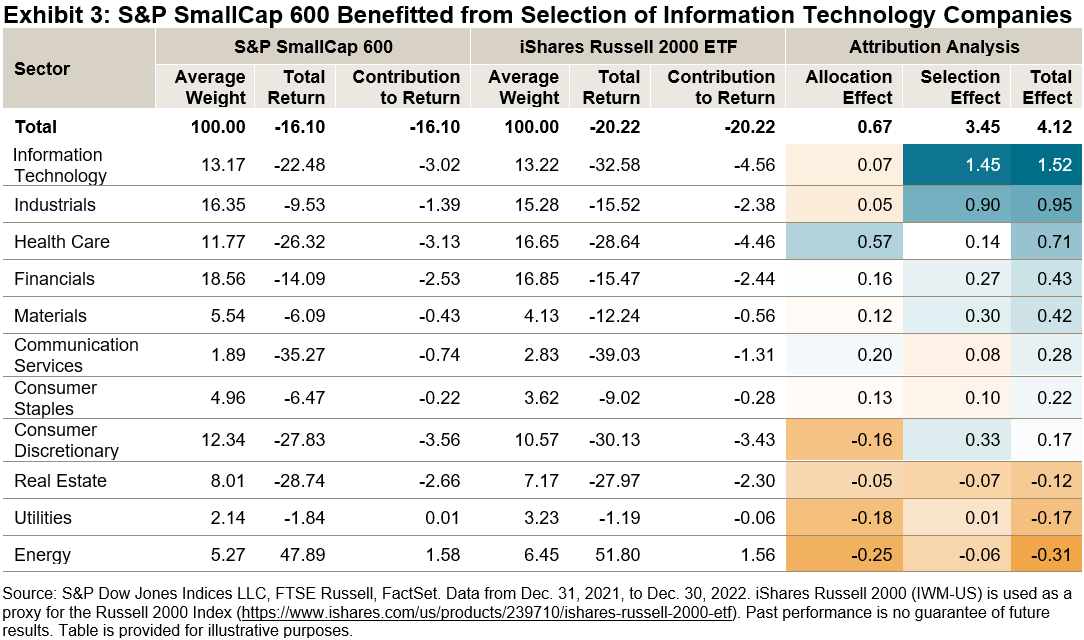
Information Technology exposure was a key reason for the outperformance of S&P DJI’s indices last year. Exhibit 3 shows that the choice of Information Technology companies (selection effect) accounted for over 80% of the overall S&P SmallCap 600 outperformance against the Russell 2000. Other major S&P DJI’s indices tell a similar story: S&P DJI’s U.S. equity indices benefited from less exposure to, and better selection in, the Information Technology sector in 2022.
(Click on image to enlarge)
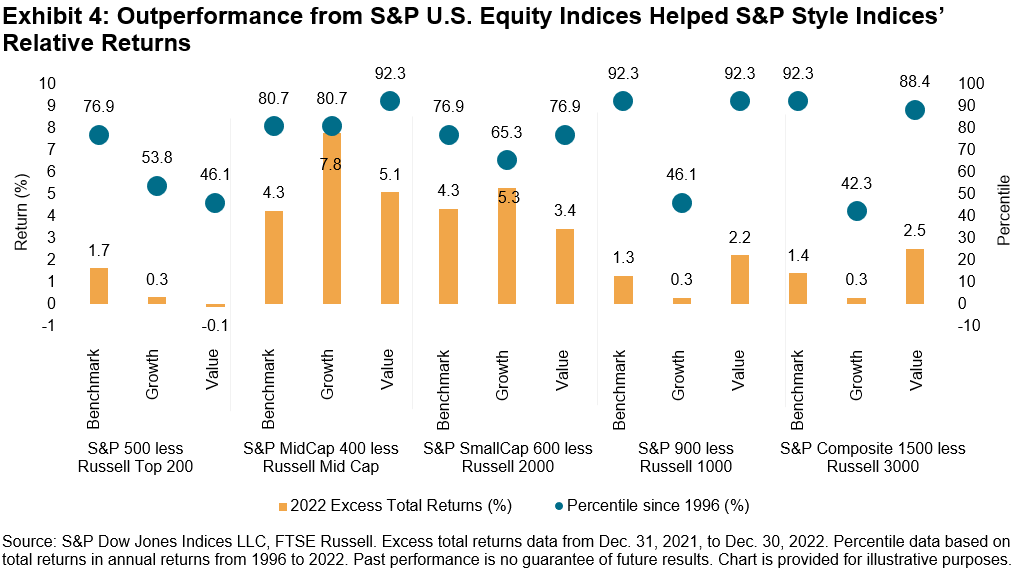
The outperformance from S&P U.S. Core Indices helped S&P Style Indices’ relative returns (see Exhibit 4). Most notably, the S&P MidCap 400 Growth outperformed Russell MidCap Growth by 7.8%, the largest margin since 2003. The S&P MidCap 400 Value outperformed Russell MidCap Value by 5.1%, the third-highest margin since 1996.
(Click on image to enlarge)
More broadly, Exhibit 5 shows how the frequency of outperformance by the S&P Style Indices generally increased with the frequency of outperformance by the S&P Core Indices. The frequency of outperformance is based on annual total returns of the S&P DJI indices and their Russell counterparts since 1996. The blue bars represent benchmark indices, while the other two colors represent S&P DJI’s outperformance conditional on the benchmark outperformance of respective style indices. For example, the S&P MidCap 400 outperformed the Russell MidCap index in 51.9% of years between 1996 and 2022. And in years when the S&P MidCap 400 outperformed, the S&P MidCap 400 Growth always outperformed the Russell MidCap Growth.
(Click on image to enlarge)
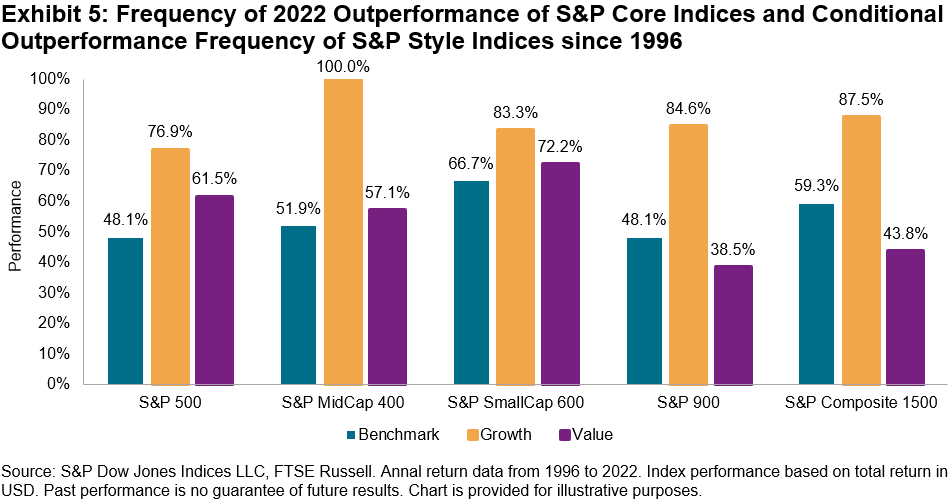
The past year was an extremely challenging time for the U.S. equity market, but the S&P Core and Style Indices generally outperformed their Russell counterparts. Once again, such differences in return highlight the potential impact of differences in index construction and how different index characteristics can impact relative returns.
More By This Author:
Commodities Could Not Escape The Sea Of Red Seen Across Asset Classes In FebruaryMomentum’s Mystique
China Equities Diverge From Developed And Emerging Markets
Disclaimer: See the full disclaimer for S&P Dow Jones Indices here.


