
China, the world’s second-largest market by both GDP and stock market capitalization, is showing itself to be a worthy diversifier, with low correlations to other equity markets.
While many developed and emerging stock market indices have traded more in sync since the onset of the COVID-19 pandemic, China has performed differently, with both domestic China A-shares and offshore-listed China equities decoupling in comparison to developed and emerging markets.
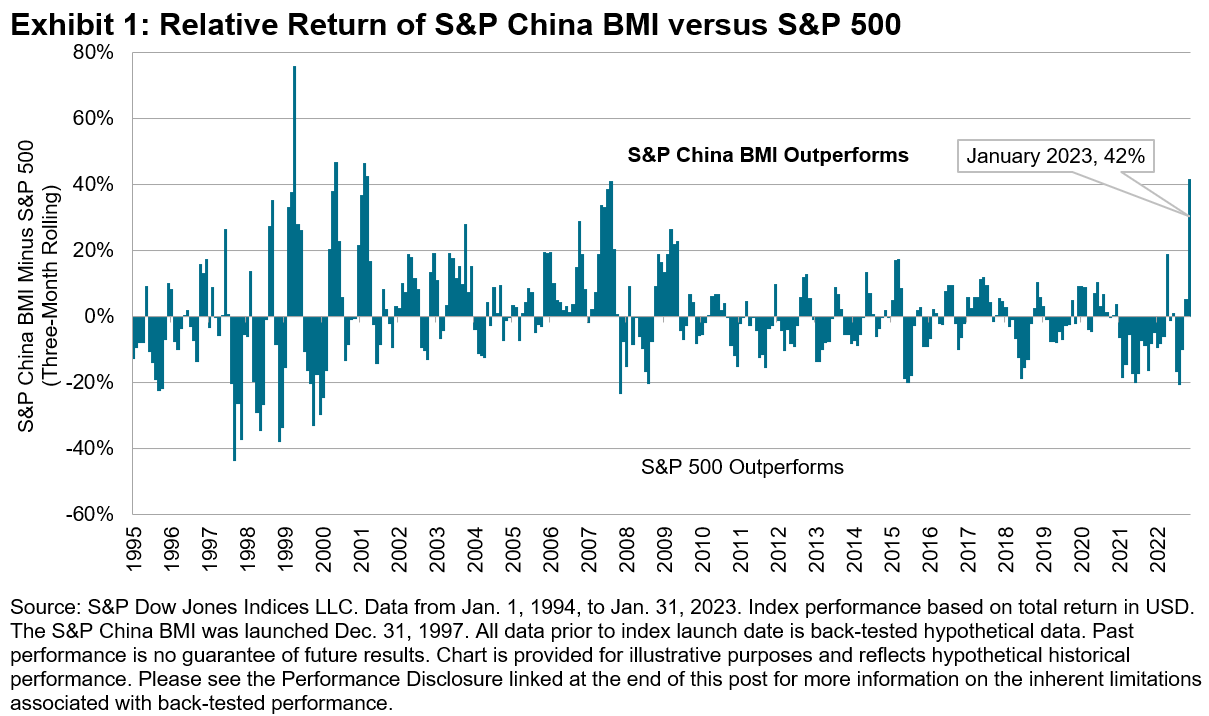
The current market environment of China easing COVID-19 restrictions, while the world grapples with higher inflation and rising rates, has resulted in further variance in equity market returns. As of Jan. 31, 2023, China equities—as measured by the S&P China Broad Market Index (BMI)—posted a 42% relative return to the S&P 500® over a three-month period. This is the highest such variance in over 20 years.
(Click on image to enlarge)
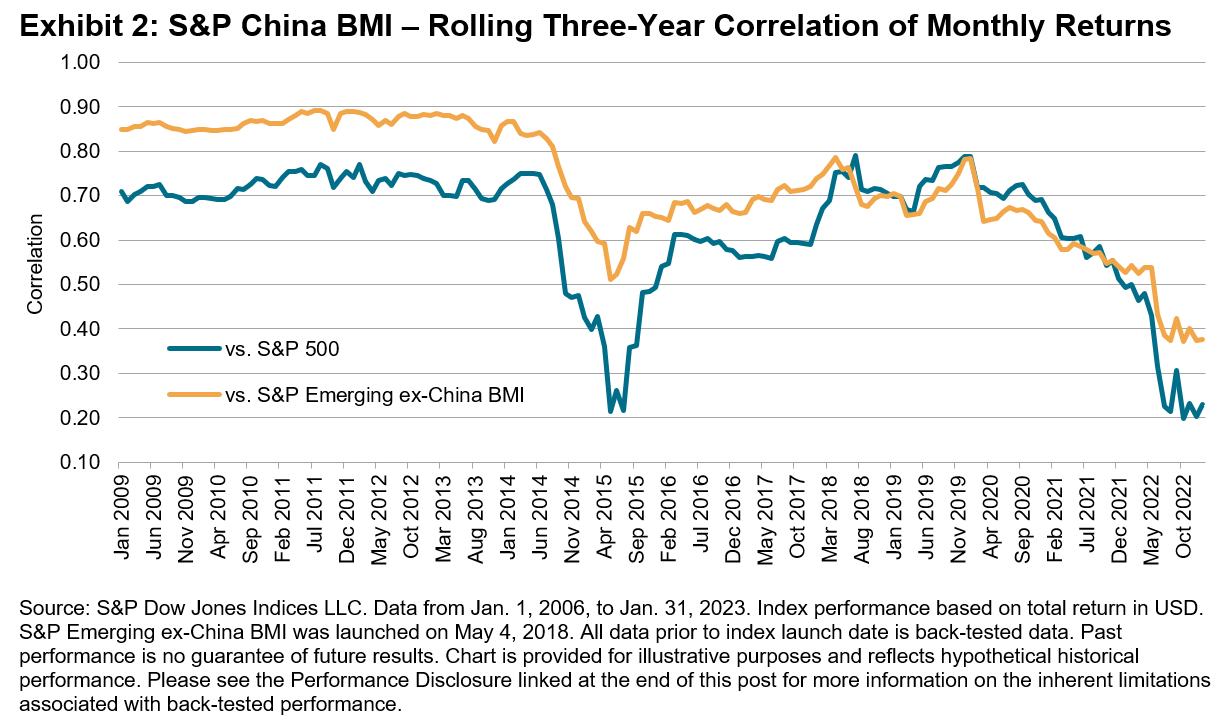
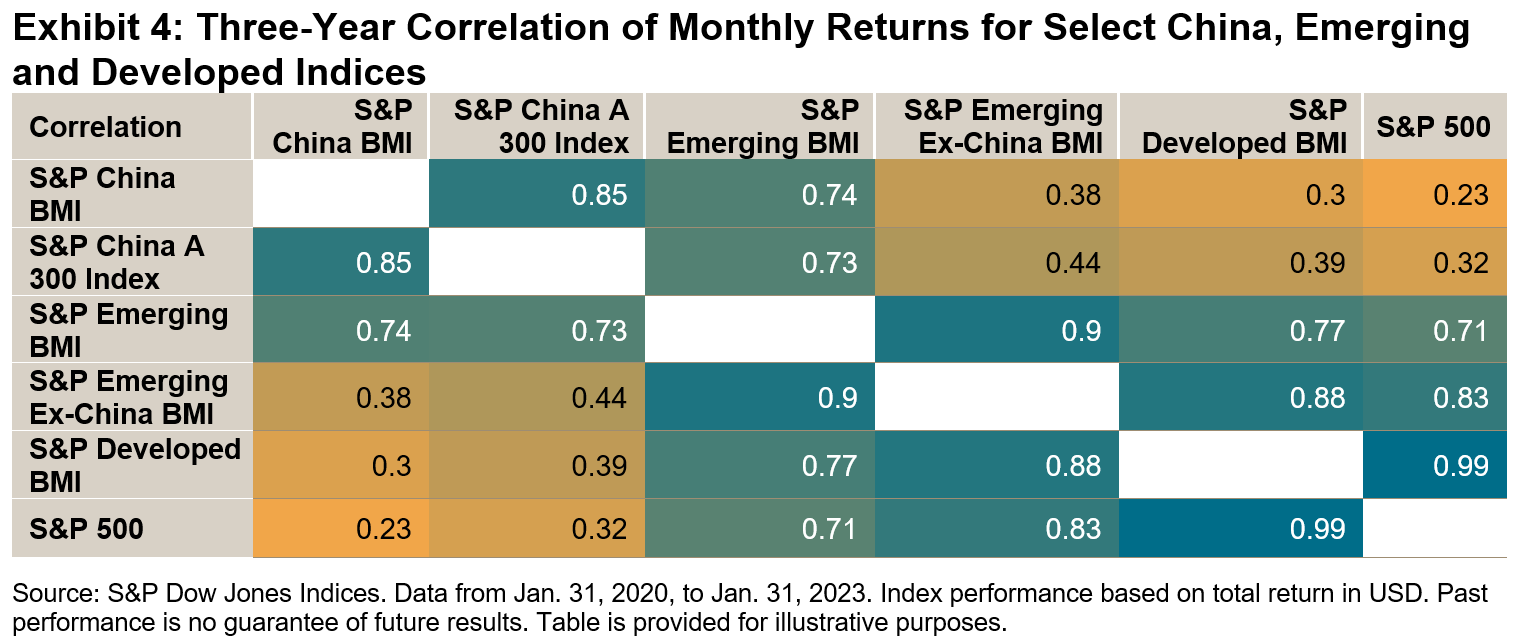
The variance of return is reflected in the correlation coefficient of monthly returns, which on a three-year basis has also reached long-term lows for China equities versus the S&P 500 and the S&P Emerging Ex-China BMI.
(Click on image to enlarge)
China and Emerging Market Equities May Offer Risk Reduction Efficiencies
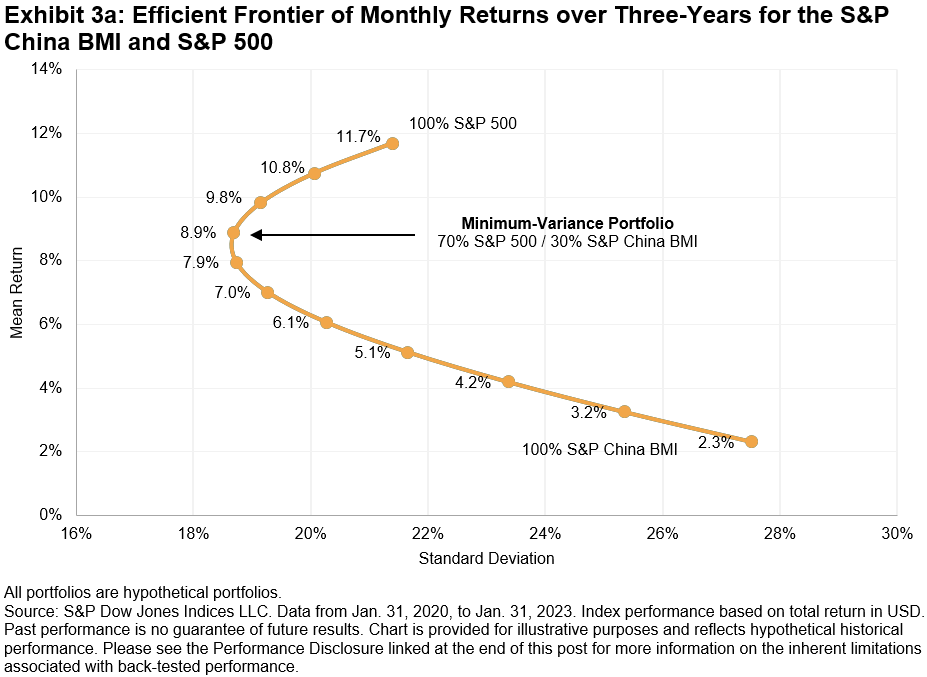
Correlation analysis is used by professional investors to help build efficient portfolios. When looking back, over the past three years China equities had a correlation coefficient of under 0.3 compared to the S&P 500 and S&P Developed BMI. Based on this, it’s possible that investors with a large portion of their portfolio in the U.S. or developed market equities could have reduced volatility by adding exposure to China equities.
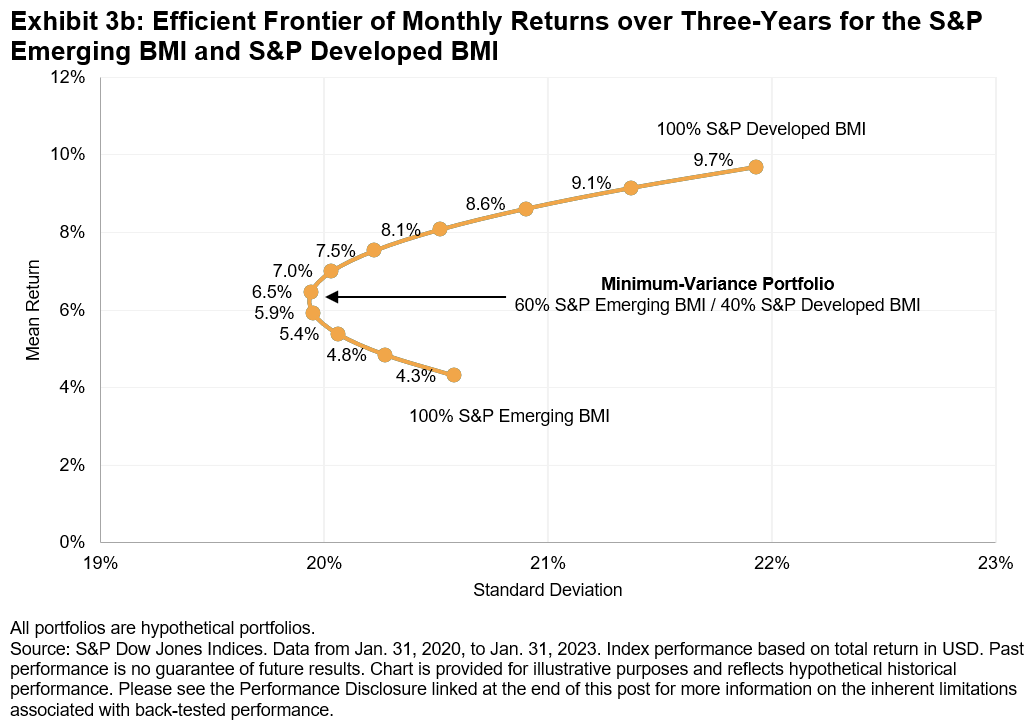
For Exhibit 3, we made several hypothetical portfolios mixing the S&P China BMI, S&P 500, S&P Emerging BMI, and S&P Developed BMI. One may think adding more volatile assets such as China or emerging market equities to a developed or U.S. equity portfolio would increase risk. However, given the low correlations, the optimal portfolio mix may actually reduce risk. Interestingly, China’s large and low correlated weight of 35.5% in the S&P Emerging BMI has resulted in the index having lower volatility than the S&P Developed BMI over the past three years, meaning a higher weight to the S&P Emerging BMI in the optimal portfolio (see Exhibit 3b).
(Click on image to enlarge)
Beyond the S&P China BMI, S&P Dow Jones Indices offers a series of China equity benchmarks reflecting a number of segments and styles covering both A-shares and offshore listings.
More By This Author:
Shipping And The World EconomyEquities Recover
Active Ability Versus Active Outperformance


Comments
Log in or sign up to join the conversation.