Active Ability Versus Active Outperformance
Some commentators have argued that today’s market environment - characterized by rising rates and economic growth concerns - is a ripe environment for stock pickers.
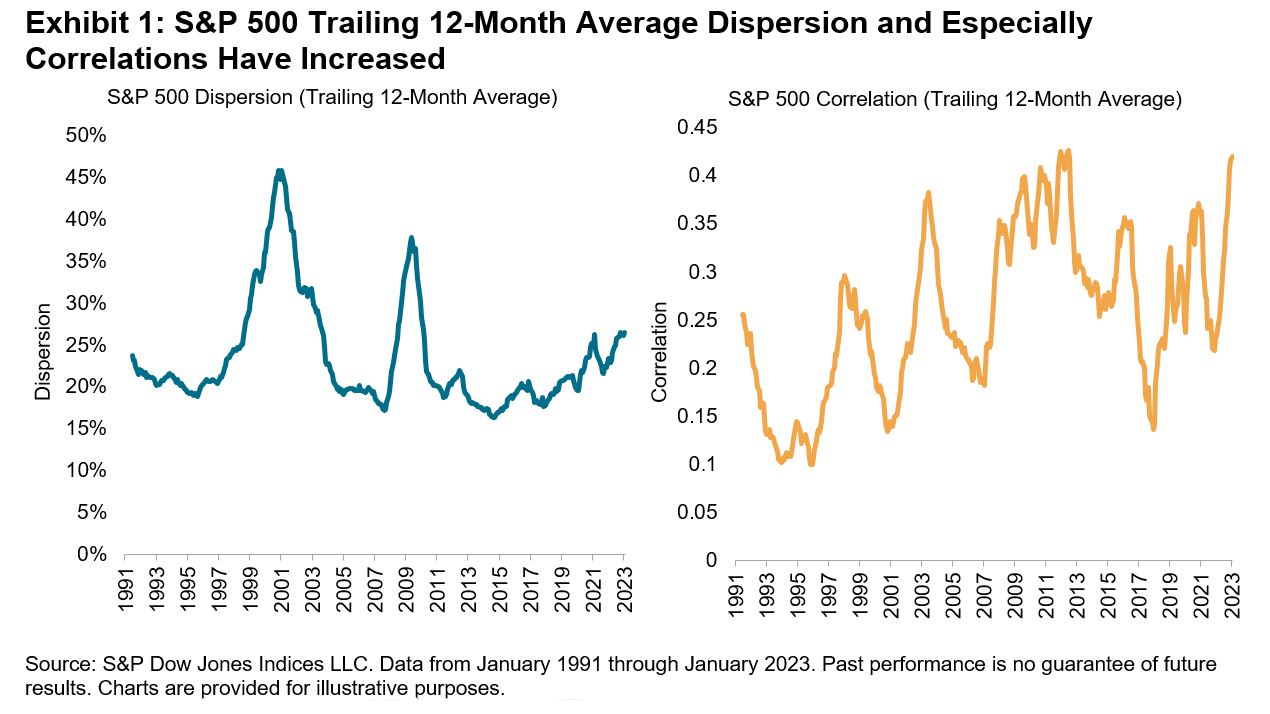
This argument is conditionally correct, as long as we remember that having the opportunity to add value does not guarantee that value gets added. In today’s environment, active managers have good potential to add value. Dispersion and correlation provide an analytic context:
- Active managers should prefer above-average dispersion because stock selection skill is worth more when dispersion is high.
- The role of correlation is more nuanced. When correlations are high, the benefit of diversification falls. Therefore, managers should prefer above-average correlations because they reduce the opportunity cost of a concentrated portfolio.
In Exhibit 1, we observe that the 12-month average dispersion of the S&P 500® has widened since 2014, while correlations have been relatively high. Higher dispersion also offers greater opportunities for active rotational strategies among countries, sectors, and factors. In January 2023, we saw the highest spread between the best and worst equity factor indices since February 2021.
(Click on image to enlarge)

Active managers typically assume incremental volatility in the hope of earning incremental returns. How high must those returns be to justify the additional volatility active managers take on? The cost of concentration helps answer this question. When correlations are low, concentrated active managers incur substantially more volatility than diversified index funds. A higher cost of concentration implies a larger foregone diversification benefit, translating into a higher hurdle for active managers to overcome.
Multiplying the cost of concentration by a rate of return consistent with the market’s historical performance, we arrive at the required incremental return shown in the top half of Exhibit 2 for the S&P 500. Driven by the higher correlations seen in Exhibit 1, this measure declined by almost half in the last 12 months, to levels not seen since mid-2012, indicating that active managers gave up a much smaller diversification benefit in 2022 compared to 2021.
The bottom half of Exhibit 2 divides the required incremental return by dispersion to translate the measure into dispersion units. We can interpret a lower number of dispersion units to mean easier conditions for active management. As both dispersion and correlations were generally higher in 2022, we observe a relatively auspicious environment for active management.
(Click on image to enlarge)

While favorable conditions do not guarantee favorable active results, last year’s relatively fortuitous conditions for stock selection may have aided manager outperformance. Just 51% of large-cap active managers lagged the S&P 500 in the first half of 2022, compared to 85% in 2021. When SPIVA® results for year-end 2022 become available, it would not be surprising to see U.S. large-cap equity funds post their lowest underperformance rate since 2009.
More By This Author:
Peak Passive And Market Efficiency
The S&P Technology Dividend Aristocrats Index: A Legacy of Dividend Increases In Technology
A Selective Approach To Style: The S&P Pure Growth And Value Indices
Disclaimer: See the full disclaimer for S&P Dow Jones Indices here.


