
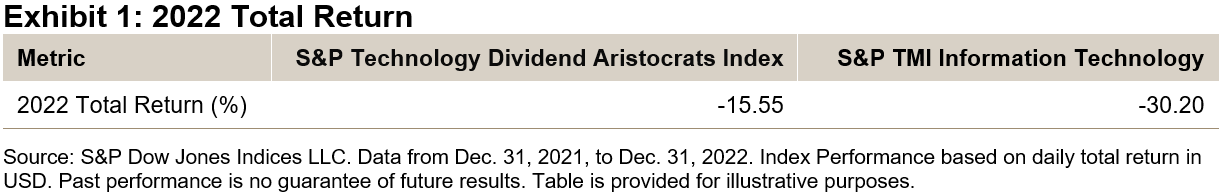
As high inflation, rising interest rates, and geopolitical risks dominated the headlines in 2022, technology stocks had a particularly difficult year. Given the many headwinds facing the sector, the S&P Total Market Index (TMI) Information Technology returned -30.20% in 2022. In spite of the challenging market environment, the S&P Technology Dividend Aristocrats® Index fared relatively well, dropping about one-half the amount of the S&P TMI Information Technology, representing an outperformance of 14.66%. In this blog, we will analyze the S&P Technology Dividend Aristocrats index methodology as well as examine its dividend emphasis and style tilts.
(Click on image to enlarge)
Methodology Overview
The universe for the S&P Technology Dividend Aristocrats Index is the Information Technology sector and the Internet & Direct Marketing Retail, Interactive Home Entertainment, and Interactive Media & Services GICS sub-industries in the S&P TMI.
To be selected, a company must have increased its dividends per share (DPS) every year for at least seven consecutive years. If the number of constituents is less than 25, the DPS increase history can be shortened to four years.1 The emphasis on increasing dividends per share could provide a ballast for investors since the ability to consistently grow dividends through different economic environments can be an indication of financial strength and discipline.
All constituents are equally weighted. This ensures broad diversification and reduces concentration risk. Lastly, the index is rebalanced annually and reweighted quarterly.
Risk/Return Profile
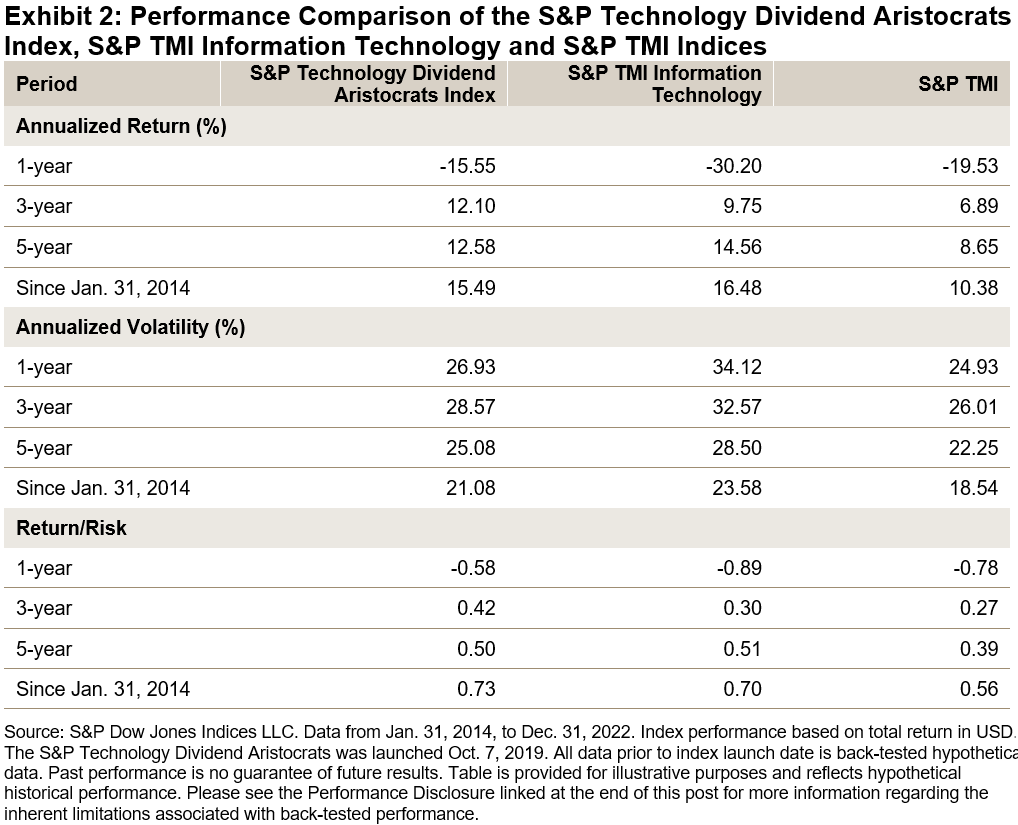
The S&P Technology Dividend Aristocrats Index outperformed both the S&P TMI Information Technology and the S&P TMI over the one- and three-year periods. Furthermore, on a risk-adjusted basis, the S&P Technology Dividend Aristocrats Index outperformed both benchmarks over all periods shown, except for the five-year period versus the S&P TMI Information Technology (0.50 versus 0.51). Importantly, the S&P Technology Dividend Aristocrats Index had lower volatility than the S&P TMI Information Technology for all periods.
(Click on image to enlarge)
Historical Dividend Growth and Dividend Yield
From Dec. 31, 2014, to Dec. 31, 2022, the S&P Technology Dividend Aristocrats Index increased its annual dividends by an annualized 14.72%, while S&P TMI Information Technology and S&P TMI Index increased their annual dividends by an annualized 11.30% and 6.42%, respectively.
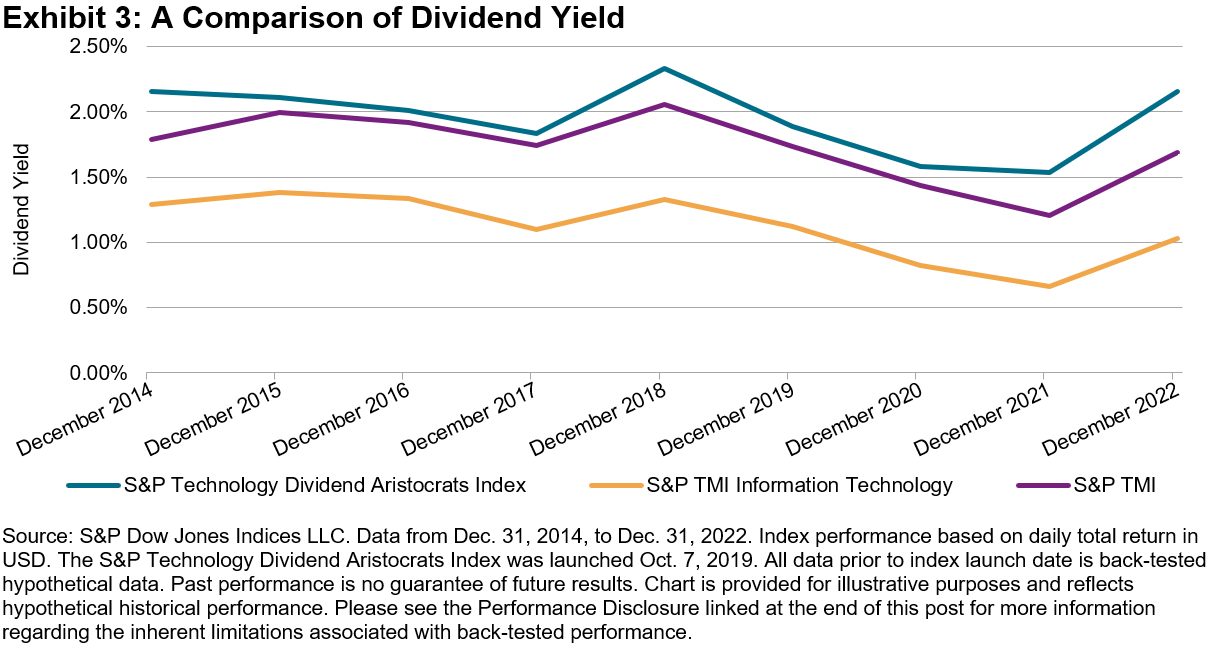
Exhibit 3 shows the annual trailing one-year dividend yield from Dec. 31, 2014, to Dec. 31, 2022. In every year over this period, the S&P Technology Dividend Aristocrats Index had a higher dividend yield than both the S&P TMI Information Technology and S&P TMI. On average, the S&P Technology Dividend Aristocrats Index had a dividend yield of 1.96%, while the S&P TMI Information Technology and S&P TMI had dividend yields of 1.12% and 1.73%, respectively.
(Click on image to enlarge)
Factor Exposure
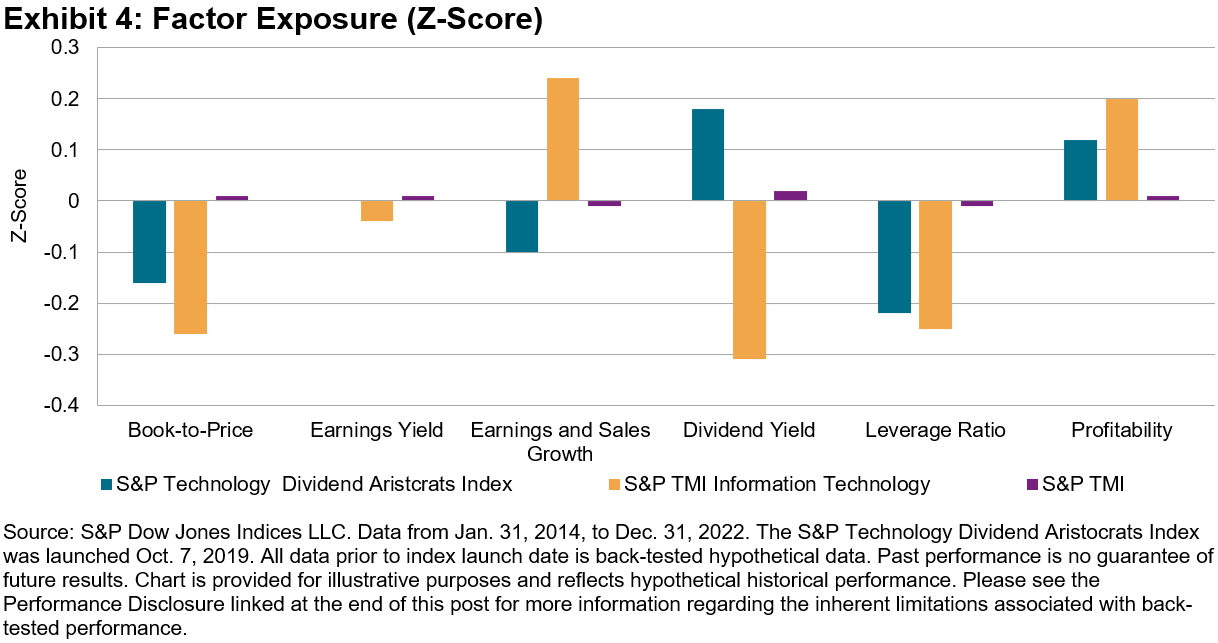
In Exhibit 4, the S&P Technology Dividend Aristocrats Index demonstrated a value and dividend yield tilt versus the S&P TMI Information Technology. Specifically, the S&P Technology Dividend Aristocrats Index had higher Axioma Risk Factor Z-scores for the book-to-price and dividend yield factors, similar exposure to earnings yield and lower exposure to growth factors. The value and dividend tilt proved beneficial in the rising interest rate environment in 2022. Holding all else equal, value and dividend stocks offered relatively more protection in a rising interest rate environment compared with growth stocks, due to their lower durations.
Furthermore, both the S&P Technology Dividend Aristocrats Index and S&P TMI Information Technology showed higher quality characteristics (lower leverage and higher profitability) than the S&P TMI.
(Click on image to enlarge)
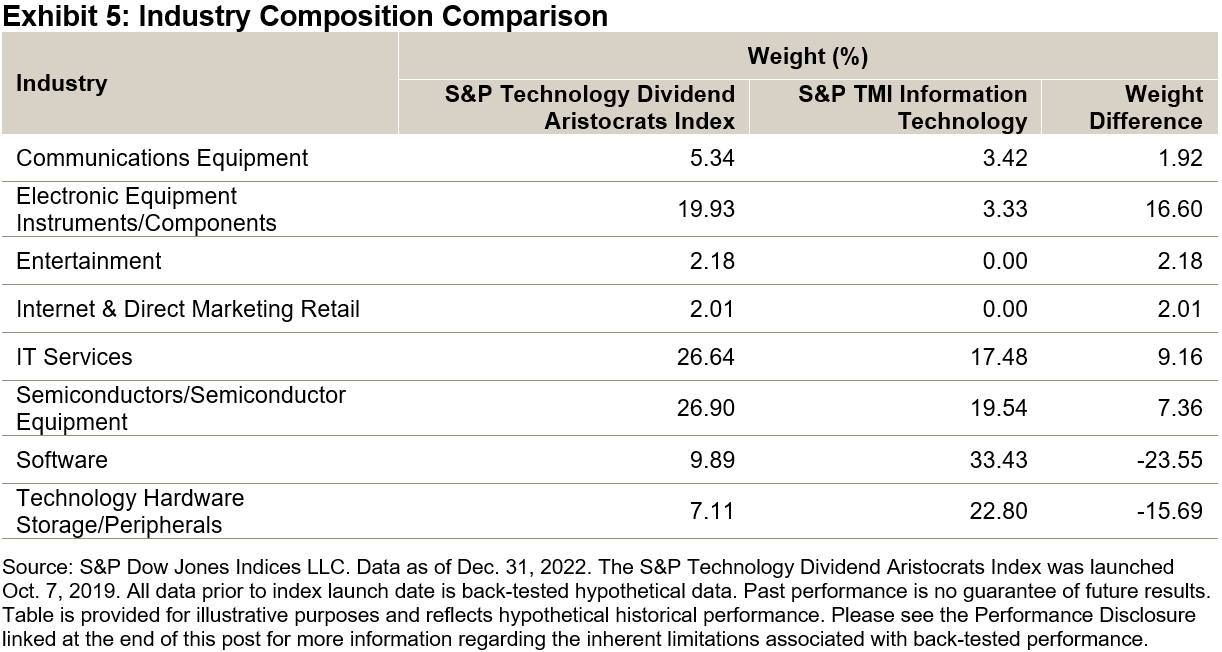
Industry Composition
Exhibit 5 shows the industry composition of the indices as of Dec. 31, 2022. The S&P Technology Dividend Aristocrats Index underweighted Software (driven by an underweight in Microsoft) and Technology Hardware Storage/Peripherals (driven by an underweight in Apple), and had a material overweight to the Electronic Equipment Instruments/Components industry.
(Click on image to enlarge)
Conclusion
Due to its emphasis on selecting companies with steady dividend increases, the S&P Technology Dividend Aristocrats Index has historically provided a solid risk-adjusted outperformance over both short- and long-term periods, a superior dividend yield and a value factor tilt in comparison with the S&P TMI Information Technology. For market participants who are interested in the technology sector and would like to have the potential for both dividend income and capital appreciation, the S&P Technology Dividend Aristocrats Index might be worth consideration.
1 Please refer to the S&P Technology Dividend Aristocrats Index Methodology for more details.
More By This Author:
A Selective Approach To Style: The S&P Pure Growth And Value Indices
Good Things Come In Threes: Muni Bonds Appear Ripe For 2023
Commodities Flat In January After Second-Best Yearly Performance In Two Decades


Comments
Log in or sign up to join the conversation.