
Market Makers Prepare For Large Moves In PTON And DOCU
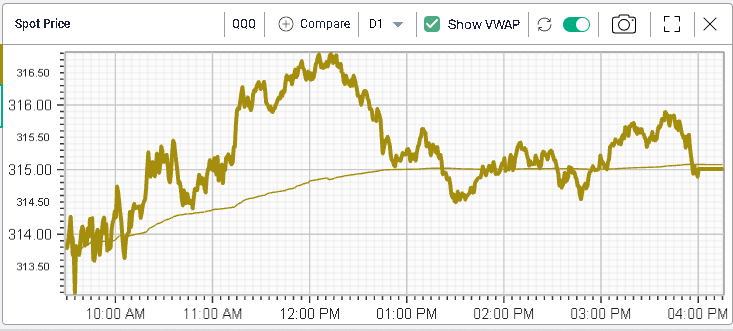
Equity indices moved higher yesterday as trader’s attention remains on Powell’s speech on Friday morning. The SPX gained 0.29%, the NDX 0.28%, and the DJIA 0.18%. Intraday ranges were fairly small and major indices traded around their VWAP all day, as shown below with the QQQ.
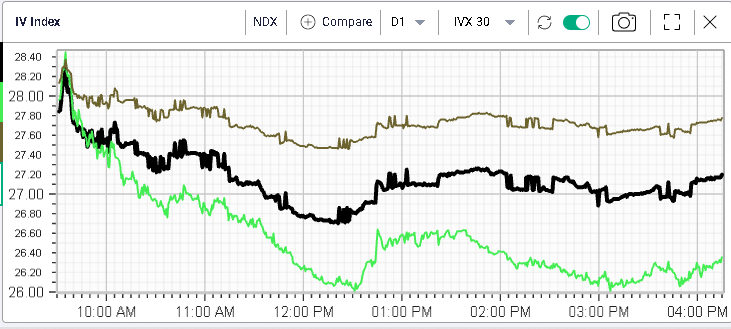
Implied Volatility moved slightly lower with short-dated maturities underperforming longer ones as shown on the below chart displaying 90 days IVX, 30d IVX, and 7 days IVX.
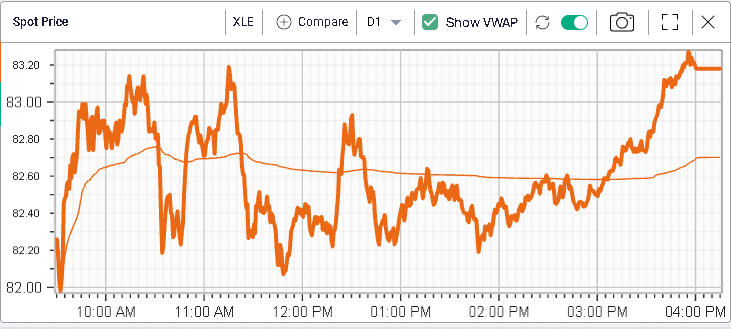
The lack of action was also visible at the sector level with the XLE displaying the best performance overall gaining around 1.2%. All the other sectors had a performance comprised between 0% and 0.6%.
The same story was true at the stock level with the components of the DJIA failing to move more than 2.5% in either direction and more than 75% of the stocks moving less than 1% over the session.
For traders looking for some action, PTON is very much in play at the moment. The stock gained more than 20% and was driven higher throughout the entire session preserving VWAP almost throughout the entire day.
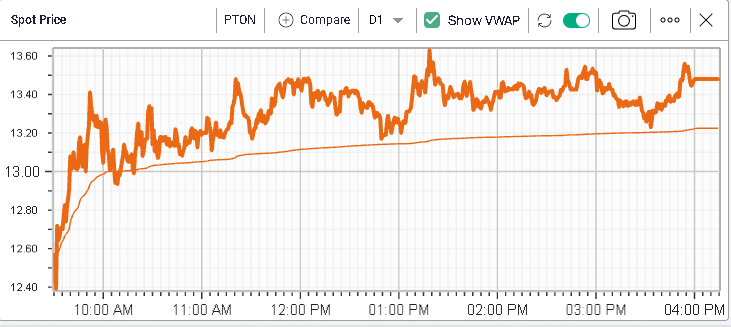
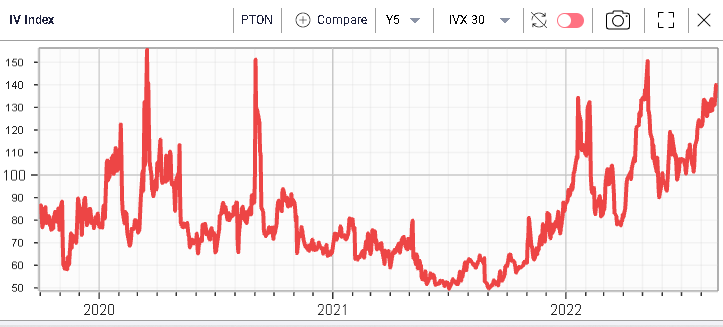
30 days implied volatility has been drifting higher reaching almost 140%. Media reports attributed the performance of the stock yesterday to an agreement between Peloton and Amazon allowing PTON to distribute its bikes through Amazon.
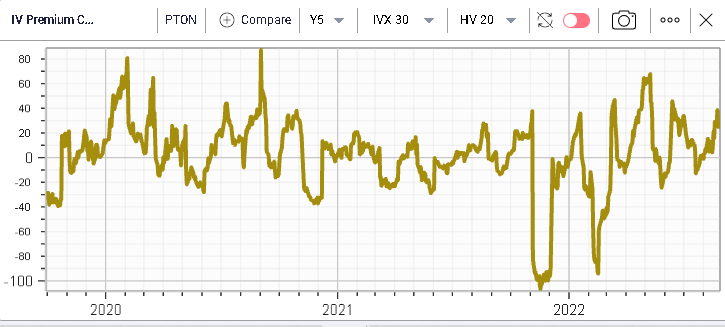
With the IV Premium 30d IV vs 20d HV trading around 25%, market makers seem worried that the stock could continue to be very volatile in the short term or they are potentially facing a large demand for options and are unable/unwilling to sell many more.
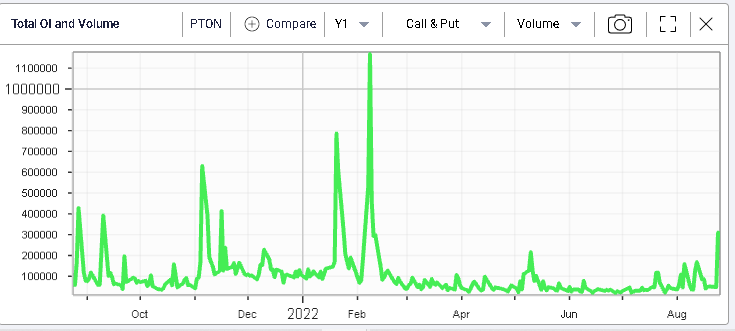
Options volumes yesterday spiked up but nowhere near the levels seen at the start of the year.
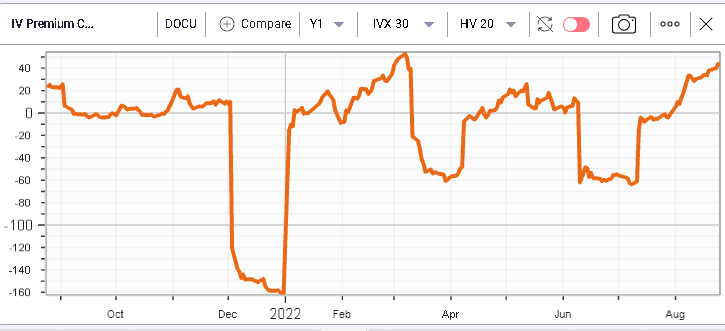
Another stock where market makers seem to be preparing for a large move is DOCU. 30d IVX in the name has jumped almost 40% in the past few weeks and is now above 100%.
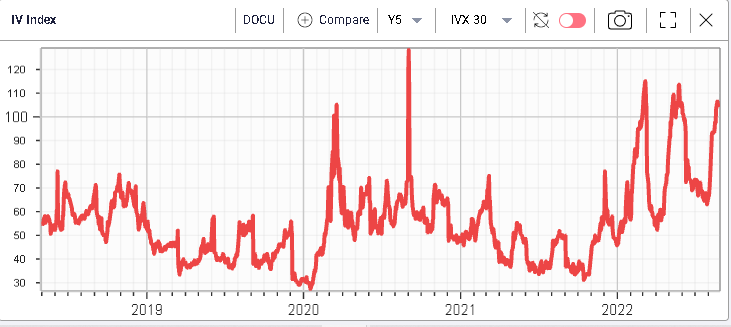
In the meantime, realized volatility has been fairly subdued with 20d HV around 60% giving an IV Premium for 30d IV vs 20d HV at a 12-months high around +40%.
More By This Author:
Term Structures Steepen, Looking At GS
Head & Shoulders Bottom V2
Expecting Capitulation
Disclaimer: IVolatility.com is not a registered investment adviser and does not offer personalized advice specific to the needs and risk profiles of its readers.Nothing contained in this letter ...
more

