
Another quiet session yesterday with the SPX closing 0.23% higher, the NDX 0.26%, and the DJIA pretty much unchanged.
Over the past few sessions, historical volatility has dropped significantly with 10d HV currently around 14.54%.
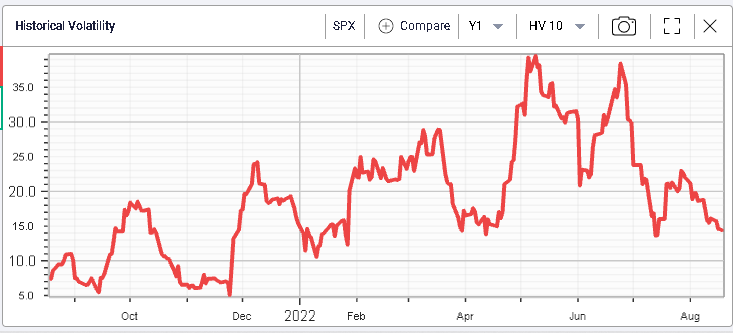
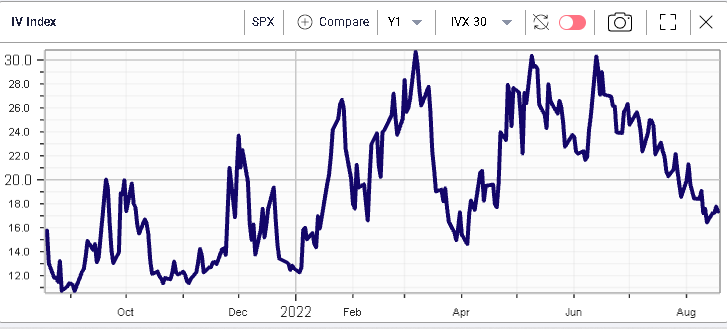
This has pushed implied volatilities lower across the board even though investors and traders seem more split than ever about the direction of the market.
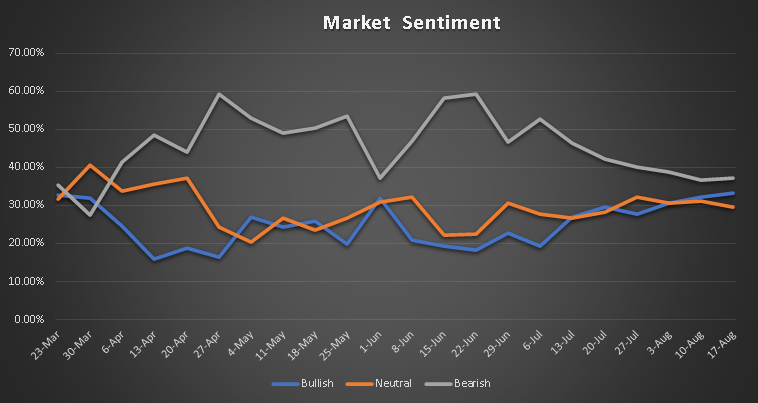
The below shows the market sentiment as collected by the AAII since March 2022. All three categories are now pretty much evenly split.
(Click on image to enlarge)
Taking a quick look at the components of the DJIA, we can see that around half the stocks have implied volatility that is greater than their realized and half have an implied lower than realized.
(Click on image to enlarge)
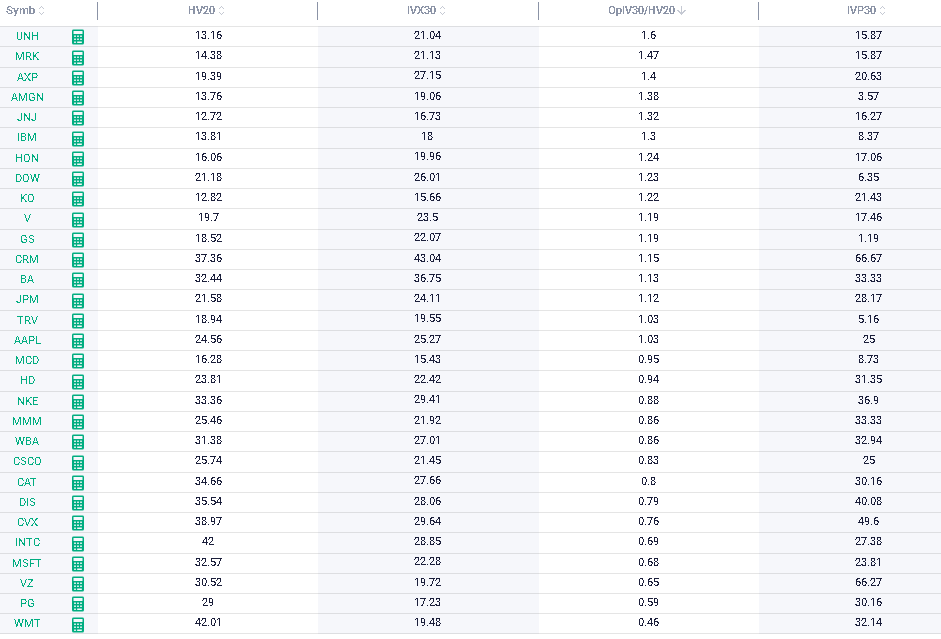
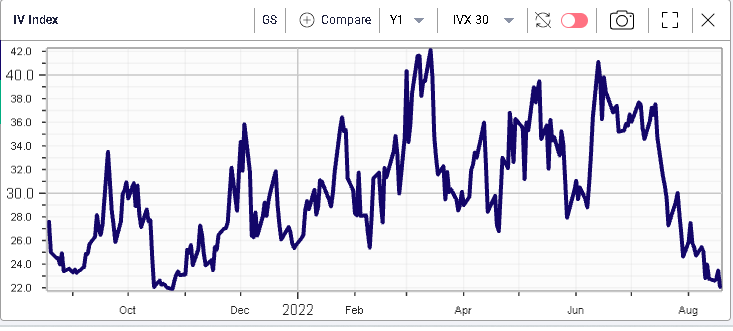
When looking at the IVP30 which shows the 12 months percentile of the 30d IVX, we can see that most stocks now have an implied volatility trading fairly low historically.
For instance, GS’s 30d IVX is now pretty much at its lowest level of the last year around 22%.
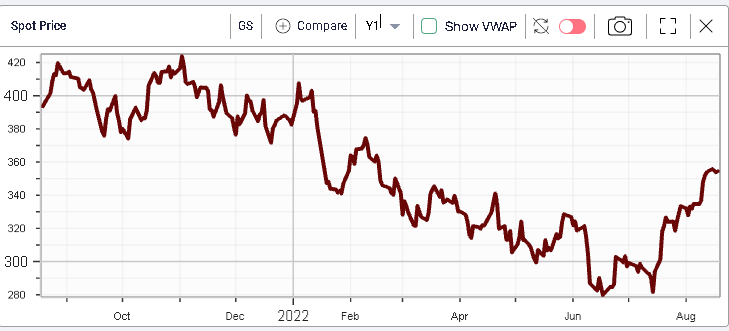
This happens at a time when the stock has had a rally but remains far off its best levels of the past year.
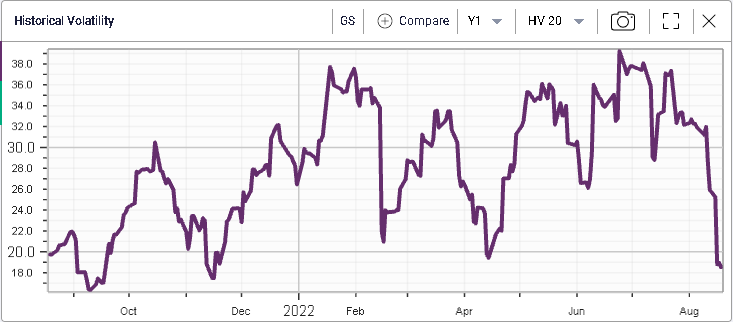
For GS as for the SPX, the main culprit is realized volatility which has been very subdued recently with 20d HV around 18.5% for the investment bank.
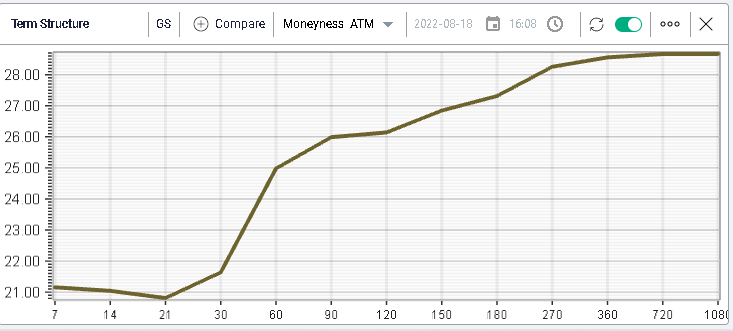
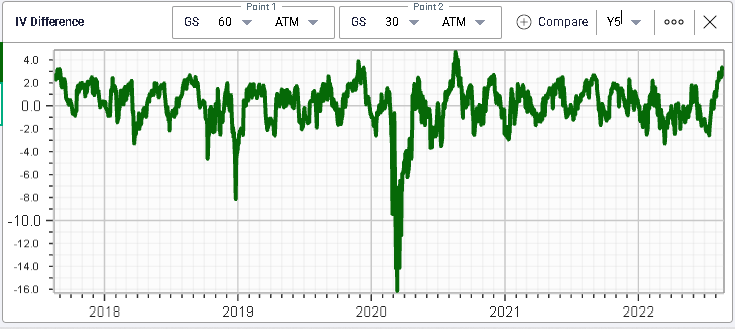
Looking at the term structure of GS, we can see that for the next months, option market makers are pretty confident that the stock will remain in a low volatility regime. Interestingly they expect this to change materially in 2 months with 60d IVX trading around 25%.
Zooming in on the difference between the 60d IVX and the 30d IVX, we can see on the below chart that the spread is now trading very close to its highest level in 5 years.
More By This Author:
Head & Shoulders Bottom V2Expecting Capitulation
Bull Spreads In BA And Bear Spreads In VZ
Comments
Log in or sign up to join the conversation.