
Encouraged by last week's CPI and PPI reports that inflation may have peaked in June markets now expect interest rates to decline as growth slows despite numerous comments from Federal Reserve officials saying rate hikes will continue. Perhaps the markets are willing to fight the Fed on the premise it will back off when unemployment rises. For now, equities continued higher after clearing an important resistance area, as shown in the updated Head & Shoulder Bottom chart.
S&P 500 Index (SPX) 4280.15 added another 134.96 points or +3.26% last week with the largest advance occurring Wednesday after the CPI report as it closed above resistance from the June 2 Milestone at 4177 reaching the 50% retracement level.
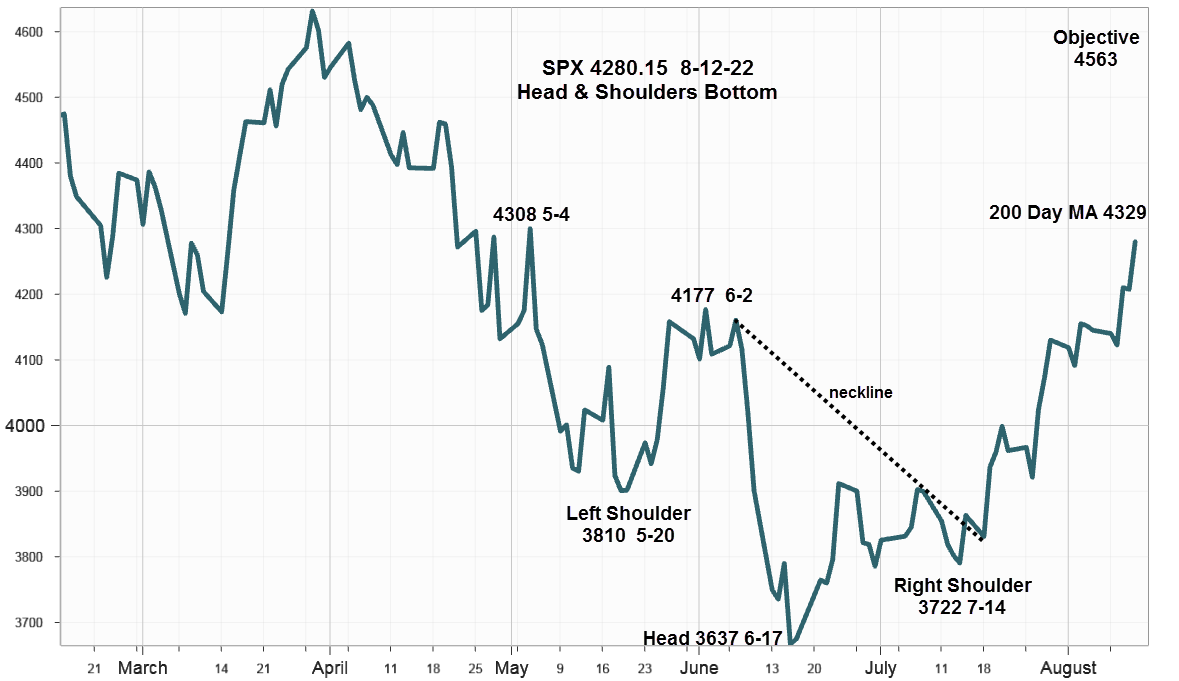
Although lopsided and right skewed, using the Head & Shoulders Bottom pattern produces an upside objective at 4563 determined by the distance from the head to the neckline added to the breakout above the neckline. While the May 4 high at 4307.68 may represent some resistance, the challenge comes from Friday's 200-Day Moving Average at 4329 where it may stall until after monthly options expiration Friday, August 19, as market makers attempt to limit their exposure to expiring in-the-money call options.
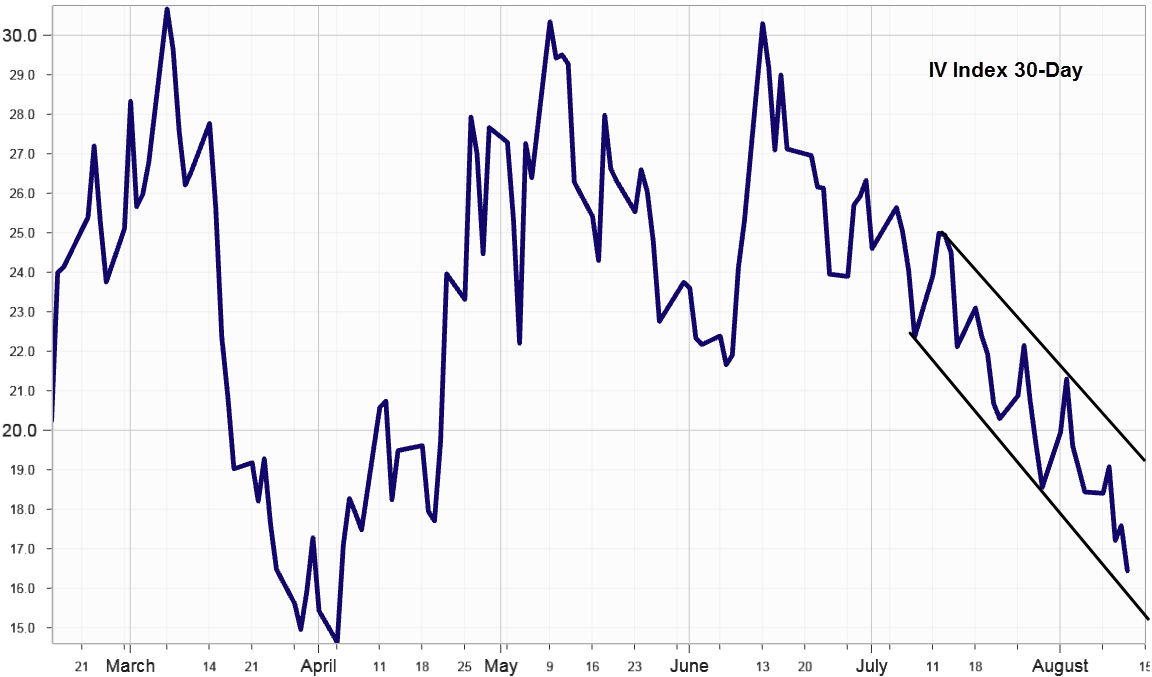
Implied Volatility
SPX options implied volatility index, VIX declined another 2.00% to 16.44% from 18.58% on August 5. Now in a well-defined downward channel as it approaches the 15%-16% level. Declining implied volatility supports the current SPX Head & Shoulders Bottom interpretation with the 4563 upside objective.
Market Breadth as measured by our preferred gauge, the NYSE ratio adjusted Summation Index that considers the number of issues traded, and reported by McClellan Financial Publications added another 259.96 points last week ending at 728.66. Increasing breadth momentum adds support to the view that the SPX will reach its upside objective at 4563 while also providing a warning should it turns lower.
Summing Up
While the lopsided Head & Shoulder Bottom suggest the SPX will probably reach the measuring objective at 4563 it offers no guarantee. Further Head & Shoulders formations can't be expected to re-trace more than the minor move that preceded it.
While markets anticipate declining interest rates as inflation declines, a loud chorus of analysts and economists including Federal Reserve officials claim advancing equities and declining rates are out-of-sync with reality. However, since trade rule number 9 says "Trade what you see not what you think," as long as the indicators remain positive, the odds favor the bulls.
More By This Author:
Expecting Capitulation
Bull Spreads In BA And Bear Spreads In VZ
Scanning for opportunities
Comments
Log in or sign up to join the conversation.