
While the market seems to be recovering to its' over reaction to the Japanese carry-trade debacle, mayhem seems to be raging all around the world from the Middle East, to Vienna, to the U.K.

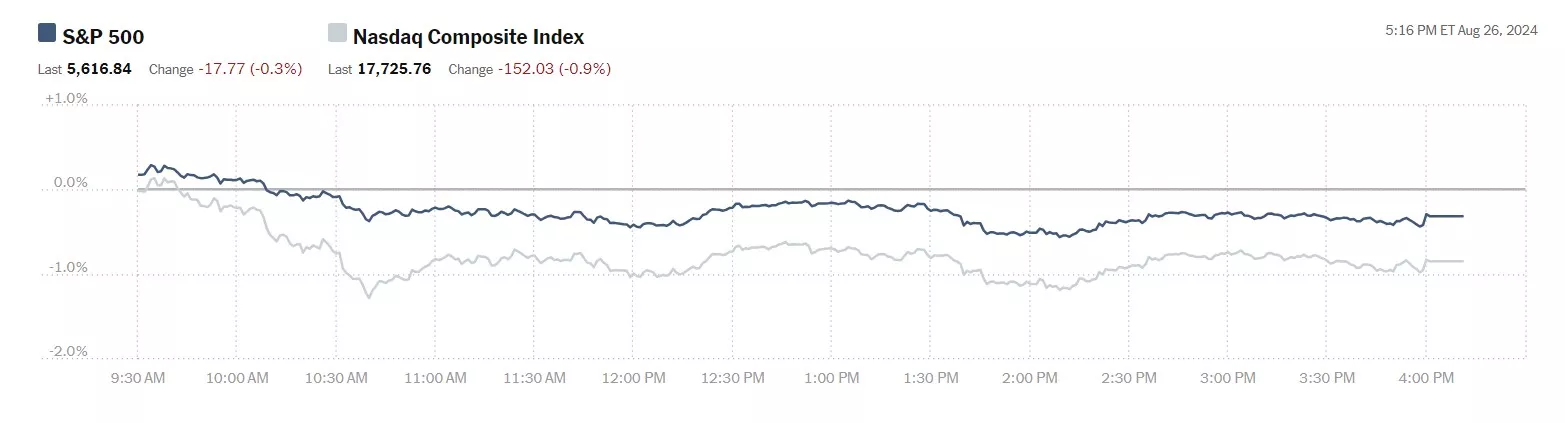
Wednesday the S&P 500 closed at 5,199, down 40 points, the Dow closed at 38,763, down 234 points, and the Nasdaq Composite closed at 16,196, down 171 points.
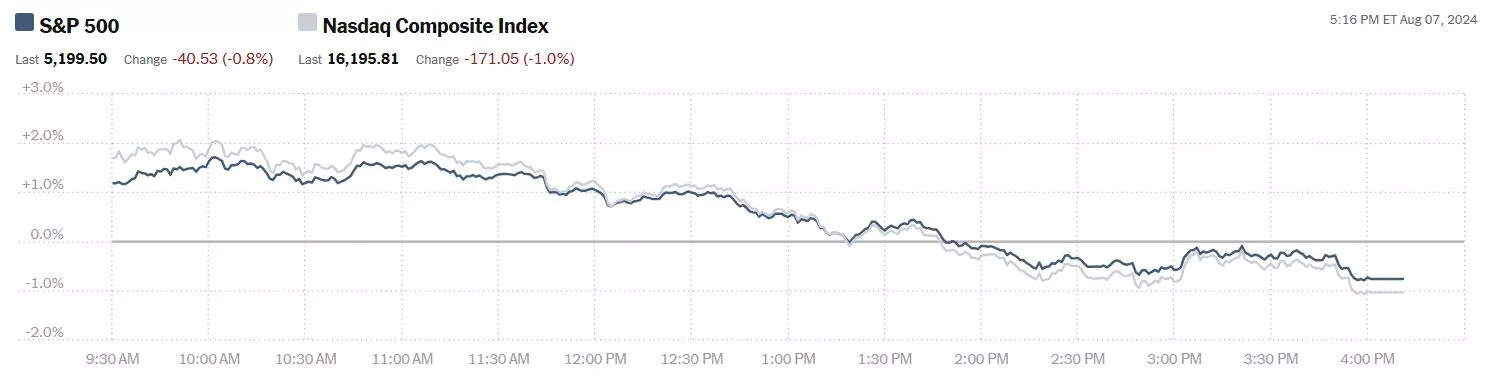
Chart: The New York Times
Most actives were led by Nvidia (NVDA), down 5.1%, followed by Intel (INTC), down 4.2% and Tesla (TSLA), down 4.4%.
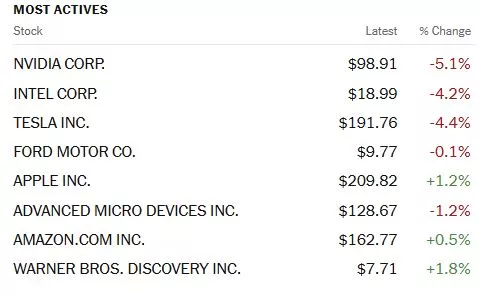
Chart: The New York Times
In morning futures trading S&P 500 market futures are down 50 points, Dow market futures are down 56 points and Nasdaq 100 market futures are up 15 points.
TalkMarkets contributor Stephen Innes writes that some are Blaring The Bear Market Siren.
"The US stock market wobbled and wavered on Wednesday, ultimately fizzling out as the day's recovery hopes melted away like a popsicle in the summer sun. Nvidia (NVDA) and other tech behemoths kicked off the day with gusto but quickly lost steam as if deciding to take an unexpected afternoon snooze. This lethargy led to a broader market slump. Nvidia itself slid down by 3.5%, while not-so-Super Micro Computer (SMCI) experienced a steep fall, plummeting over 20% following a disappointing reveal of their fiscal fourth-quarter earnings. The once meteoric rise of AI stocks has left investors spellbound, questioning whether this surge is merely a dazzling but ephemeral spectacle in the financial firmament.
Meanwhile, our ever-vigilant VIX, the maestro of market trepidation, continues to wave its "proceed with caution" banner, prompting Wall Street to focus more on unpacking risks rather than gearing up for a bullish journey...

Despite a dusting of dovish reassurances from the Bank of Japan aimed at calming the markets, the idea of quickly returning to a state of low Macro and FX volatility might be overly hopeful. It's probably as likely as spotting a unicorn lounging at a Wall Street trading desk. Indeed, the afternoon dip in U.S. markets was a stark reminder that the trading environment remains as daunting and unpredictable as ever.
Why the concern? The potential for a broader U.S. economic slowdown, misaligned global monetary policies, and the bubbling geopolitical tensions in the Middle East cast long, ominous shadows across financial markets. Furthermore, the U.S. political election looms, potentially turning the markets into more of a chaotic mosh pit than a graceful waltz.
Here’s a deeper look: The spectre of a U.S. economic downturn hangs heavily, stirring unease throughout the financial world. Simultaneously, central banks globally are out of sync, playing their own tunes and creating dissonance rather than harmony. In the Middle East, the situation is a tinderbox, with tensions a mere spark away from escalating into full-blown conflicts that could send oil prices—and consequently, global inflation—skyrocketing. These elements converge to craft a market climate rife with volatility and unpredictability...
As I cautioned my traders today, thankfully, this week features a light U.S. economic calendar, a small mercy given that a barrage of bleak economic data is the last thing needed in such a tense atmosphere.
Prepare for a potentially "Turbulent Thursday" and brace for what might become a "Frantic Friday.""
Economist and contributor Menzie Chinn looks at Revisiting The Recession Call Of 2022H1.
"Now that we’re talking recession (again), it seems like a good idea to remind ourselves of the last time some observers declared unequivocally that we were in recession, to wit, Steven Kopits, January 2, 2023:
So in H1, we were facing an implosion of productivity through mid-year, declining GDP to mid-year, declining VMT, declining gasoline consumption and yet 1.1 m new jobs per Establishment Survey from March to June. Those numbers do not square. Something is out of whack. The other numbers we might use to cross check the Establishment Survey don’t line up with it. That suggests the HH survey was probably closer to the truth.
Now, this is not my area of expertise, much less an area of interest. But I can look at the basic numbers and say that the other metrics we might check suggest the Est Survey was wrong.
You, Menzie, held the Est Survey was more likely right. You wrote: So: (1) I put more weight on the establishment series, and (2) the gap between the two series is more likely due to increasing, and biased, measurement error in the household series, rather than, for instance, primarily increases in multiple-job holders. https://econbrowser.com/archives/2022/12/the-household-establishment-job-creation-conundrum
Dead wrong, as it turned. And predictably so.
You were wrong because you did not consider the statistics more holistically. That’s the learning point for your students. Cross check your indicators if you have dials which are telling you different things. If jobs are increasingly rapidly, then GDP should also be up. If jobs are increasing rapidly, then mobility and gasoline consumption should also be up, because so many people need to drive to work in this country. Finally, if productivity is imploding when jobs are up, you really need to take a pause and put together some sort of narrative as to why that might be happening. It suggests something anomalous in the data which requires closer inspection.
Had you done that, Menzie, you might have concluded as did the Philly Fed (from my earlier comment):
From the Philadelphia Fed:
Early Benchmarks for All 50 States and the District of Columbia
Estimates by the Federal Reserve Bank of Philadelphia indicate that the employment changes from March through June 2022 were significantly different in 33 states and the District of Columbia compared with current state estimates from the Bureau of Labor Statistics’ (BLS) Current Employment Statistics (CES). Early benchmark estimates indicated higher changes in four states, lower changes in 29 states and the District of Columbia, and lesser changes in the remaining 17 states.Our estimates incorporate more comprehensive, accurate job estimates released by the BLS as part of its Quarterly Census of Employment and Wages (QCEW) program to augment the sample data from the BLS’s CES that are issued monthly on a timely basis. All percentage change calculations are expressed as annualized rates.
In the aggregate, 10,500 net new jobs were added during the period rather than the 1,121,500 jobs estimated by the sum of the states; the U.S. CES estimated net growth of 1,047,000 jobs for the period.
So, for March through June 2022, the CES estimated 1.1 m new jobs. The Fed’s revision took that down to 10,500.
Looks like the Philly Fed is supportive of my suppositions.
And by the way, don’t we also suspect that the additional 1.6 m jobs adds after June per the Est Survey may also be a phantom. If the HH survey proves right again, then those H2 jobs gains (through November) will evaporate, just as the March to June numbers did.
I tried to stress how the data were likely to be revised. In particular, I noted that most macroeconomists focused on business cycle fluctuations put most weight on the establishment survey. With a year and a half additional data, what can we see about what the data say. First, with respect to employment.
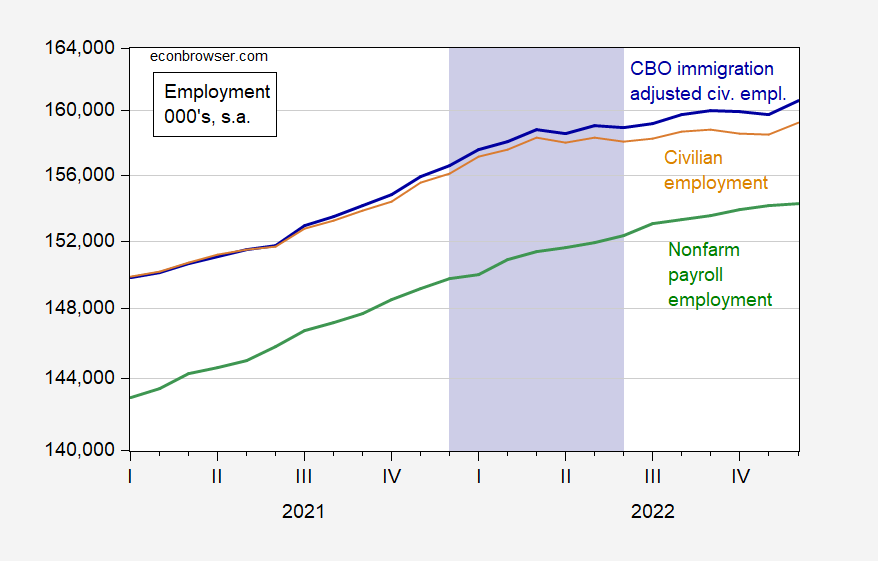
Figure 1: Nonfarm payroll employment from CES (green), civilian employment from CPS (tan), civilian employment, adjusted to account for CBO estimates of immigration (blue), all in 000’s, s.a. Putative peak-to-trough recession of 2022H1 shaded lilac. Source: BLS, CBO, and author’s calculations.
Note that there have been two benchmark revisions of the CES numbers, as well as one early benchmark from the Philadelphia Fed, since Mr. Kopits wrote his comment, and yet the current version of nonfarm payroll employment rose throughout the 2021-22 period, so we can put some faith in the NFP series over this period...
What about the James Hamilton markov switching model for recession definition, given the decline in GDP in 2022Q1-Q2?
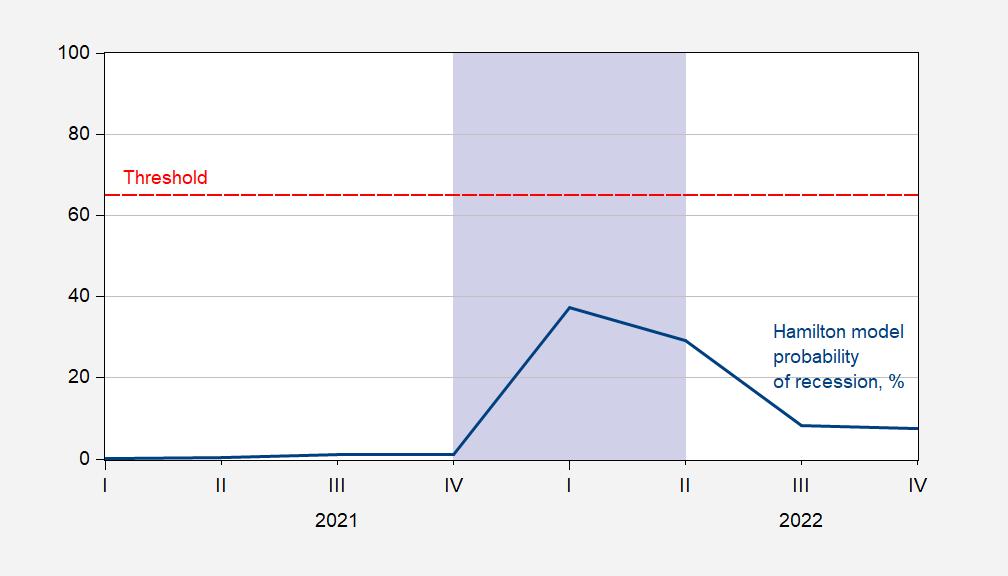
Figure 3: Probability of being in a recession, from James Hamilton model, in %. Threshold denoted by red dashed line. Putative peak-to-trough recession of 2022H1 shaded lilac. Source: FRED.
The indicator remains far below the threshold.
What about the Sahm rule (real time)?
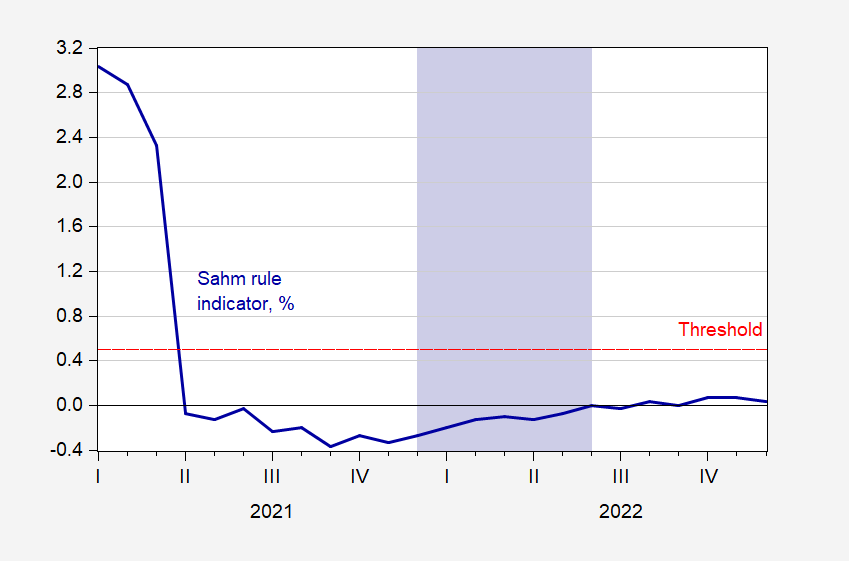
Figure 4: Real time Sahm rule indicator, in % (blue). Threshold denoted by red dashed line. Putative peak-to-trough recession of 2022H1 shaded lilac. Source: FRED.
This indicator was also very far below the threshold.
Finally, Mr. Kopits cited two series as supportive of his recession thesis. Unfortunately, neither are very predictive of recessions as defined by NBER’s Business Cycle Dating Committee.
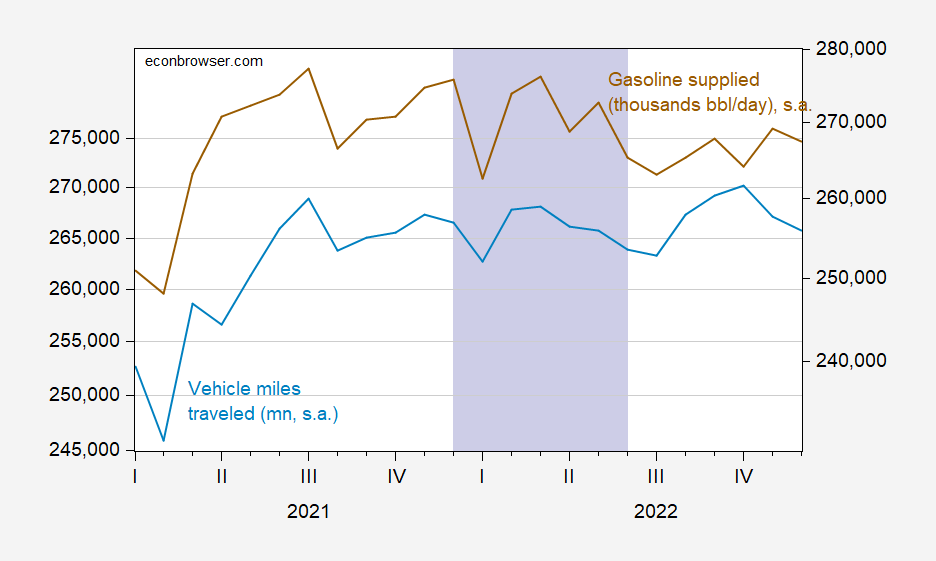
Figure 5: Vehicle miles traveled, mn., s.a. (light blue, left scale), gasoline supplied, thousands bbl/day (brown, right scale). Gasoline supplied seasonally adjusted by author using X-13 (in logs). Putative peak-to-trough recession of 2022H1 shaded lilac. Source: NHTSA via FRED, EIA, and author’s calculations.
Remember, Mr. Kopits wrote as recently as September 2023:
I am pretty comfortable with both my H1 2022 call and with the role of gasoline/diesel consumption and VMT as indicators of economic stress or comfort, as the case may be. I’d note that US oil and gas consumption remains depressed by about 5% compared to normal but hasn’t changed much in the last year or so.
Wow!"
There are several other charts detailing this argument in the full article.
There are several factors outside the stock indices per se that are impacting market action. Before closing out the column today we take a look at some of those.
TM contributor Crispus Nyaga updates us on A BTC/USD Forex Signal: Death Cross Meets Falling Wedge.

Bearish view
- Sell the BTC/USD pair and set a take-profit at 49,000.
- Add a stop-loss at 60,000.
- Timeline: 1-2 days.
Bullish view
- Set a buy-stop at 56,500 and a take-profit at 58,500.
- Add a stop-loss at 53,000.
")
Bitcoin price lost momentum in the overnight session as analysts cautioned that the unwinding of the Japanese yen trade could take time and that it still threatens the market. The BTC/USD pair retreated to 54,865, down from Wednesday’s high of over 57,000.
Bitcoin’s (BITCOMP) retreat coincided with that of US stocks as the Dow Jones, S&P 500, and Nasdaq 100 indices erased their initial gains and dropped by over 60 basis points. It also happened as the VIX index rose by 5% and the US dollar index spiked by 0.25%...
Bitcoin has also formed a hammer candlestick pattern whose lower side was Monday’s low of 49,000. A hammer is one of the top reversal signs in the financial market. Therefore, these patterns point to more upside in the next few weeks.
On the negative side, Bitcoin has formed a series of lower lows and lower highs, meaning that it is in a bearish trend. It is also about to form a death cross pattern as the 200-day and 50-day simple moving average is about to form a bearish crossover.
Therefore, the pair will likely be volatile in the next few days. A break below this week’s low at 49,000 will invalidate the bullish patterns and point to more downside."
Contributor Dave Skarica says that Gold’s Moment Of Truth: It Happened Over 13 Years Ago. It’s About To Happen Once More.

Gold’s moment of truth already happened.
Over 13 years ago, central banks proved gold’s value.
(These are the people who are supposed to be manufacturing trust in their fiat system more than gold as an “asset” class.)
Instead of selling gold, they started buying…
And ever since, it hasn’t stopped because bankers knew what would happen…

...From 2008 on, global central banks have bought gold roughly following interest rate movement for the past 16 years.
Yes, gold bugs have been buying gold much longer.
And they’re about to be proven right...
When the Federal Reserve decides to start cutting rates…
We will likely see more gold buying by central banks around the globe..."
We take a look at natural gas (UNG) with Warren Patterson and Ewa Manthey who write in The Commodities Feed: Gas Supply Risks Build.
"European natural gas prices surged higher yesterday. TTF front-month futures settled more than 4.8% higher on the day taking prices to their highest level this year. The rally comes after reports that Ukrainian troops launched an attack on the Kursk region in Russia, which has led to a state of emergency being called. There are also some unconfirmed reports that Ukrainian troops captured the Sudzha entry point, which is the only current entry point of Russian pipeline gas into Ukraine, which ultimately ends up in the EU. Around 42mcm/d of gas comes in via this entry point. If these reports turn out to be true, it increases the risk that we see a more sudden stop in Russian pipeline flows via Ukraine. However, there does not appear to be any disruption up until now. The market is already bracing itself for an end to these flows at the end of the year when Gazprom’s transit deal with Ukraine expires, but the potential to lose this supply even earlier would be a shock to the system.
This recent development will provide speculators with another excuse to add to their net long in TTF. The latest positioning data shows that investment funds increased their net long by a significant 60.5TWh over the last reporting week to 192TWh - the highest level since September 2021."
See the full article for updates on metals and cocoa.
That's a wrap for today.
Don't panic about your stocks, but be careful.
Peace.

More By This Author:
Tuesday Talk: A Big Dip
Thoughts For Thursday: All About Earnings
Tuesday Talk: Almost Gone Fishing Time

Comments
Log in or sign up to join the conversation.