

Image Source: Pixabay
Now that we’re talking recession (again), it seems like a good idea to remind ourselves of the last time some observers declared unequivocally that we were in recession, to wit, Steven Kopits, January 2, 2023:
So in H1, we were facing an implosion of productivity through mid-year, declining GDP to mid-year, declining VMT, declining gasoline consumption and yet 1.1 m new jobs per Establishment Survey from March to June. Those numbers do not square. Something is out of whack. The other numbers we might use to cross check the Establishment Survey don’t line up with it. That suggests the HH survey was probably closer to the truth.
Now, this is not my area of expertise, much less an area of interest. But I can look at the basic numbers and say that the other metrics we might check suggest the Est Survey was wrong.
You, Menzie, held the Est Survey was more likely right. You wrote: So: (1) I put more weight on the establishment series, and (2) the gap between the two series is more likely due to increasing, and biased, measurement error in the household series, rather than, for instance, primarily increases in multiple-job holders. https://econbrowser.com/archives/2022/12/the-household-establishment-job-creation-conundrum
Dead wrong, as it turned. And predictably so.
You were wrong because you did not consider the statistics more holistically. That’s the learning point for your students. Cross check your indicators if you have dials which are telling you different things. If jobs are increasingly rapidly, then GDP should also be up. If jobs are increasing rapidly, then mobility and gasoline consumption should also be up, because so many people need to drive to work in this country. Finally, if productivity is imploding when jobs are up, you really need to take a pause and put together some sort of narrative as to why that might be happening. It suggests something anomalous in the data which requires closer inspection.
Had you done that, Menzie, you might have concluded as did the Philly Fed (from my earlier comment):
From the Philadelphia Fed:
Early Benchmarks for All 50 States and the District of Columbia
Estimates by the Federal Reserve Bank of Philadelphia indicate that the employment changes from March through June 2022 were significantly different in 33 states and the District of Columbia compared with current state estimates from the Bureau of Labor Statistics’ (BLS) Current Employment Statistics (CES). Early benchmark estimates indicated higher changes in four states, lower changes in 29 states and the District of Columbia, and lesser changes in the remaining 17 states.Our estimates incorporate more comprehensive, accurate job estimates released by the BLS as part of its Quarterly Census of Employment and Wages (QCEW) program to augment the sample data from the BLS’s CES that are issued monthly on a timely basis. All percentage change calculations are expressed as annualized rates.
In the aggregate, 10,500 net new jobs were added during the period rather than the 1,121,500 jobs estimated by the sum of the states; the U.S. CES estimated net growth of 1,047,000 jobs for the period.
So, for March through June 2022, the CES estimated 1.1 m new jobs. The Fed’s revision took that down to 10,500.
Looks like the Philly Fed is supportive of my suppositions.
And by the way, don’t we also suspect that the additional 1.6 m jobs adds after June per the Est Survey may also be a phantom. If the HH survey proves right again, then those H2 jobs gains (through November) will evaporate, just as the March to June numbers did.
I tried to stress how the data were likely to be revised. In particular, I noted that most macroeconomists focused on business cycle fluctuations put most weight on the establishment survey. With a year and a half additional data, what can we see about what the data say. First, with respect to employment.
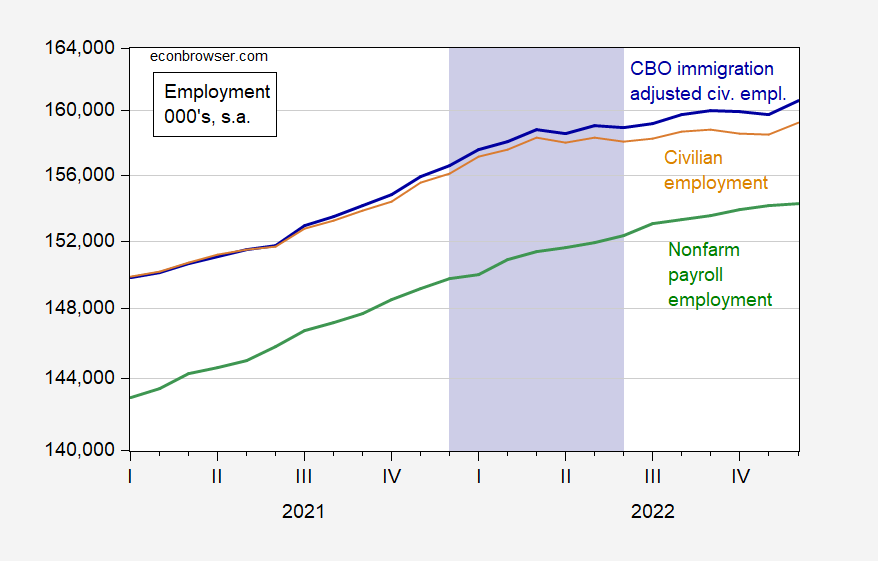
Figure 1: Nonfarm payroll employment from CES (green), civilian employment from CPS (tan), civilian employment, adjusted to account for CBO estimates of immigration (blue), all in 000’s, s.a. Putative peak-to-trough recession of 2022H1 shaded lilac. Source: BLS, CBO, and author’s calculations.
Note that there have been two benchmark revisions of the CES numbers, as well as one early benchmark from the Philadelphia Fed, since Mr. Kopits wrote his comment, and yet the current version of nonfarm payroll employment rose throughout the 2021-22 period, so we can put some faith in the NFP series over this period.
What about aggregate output?
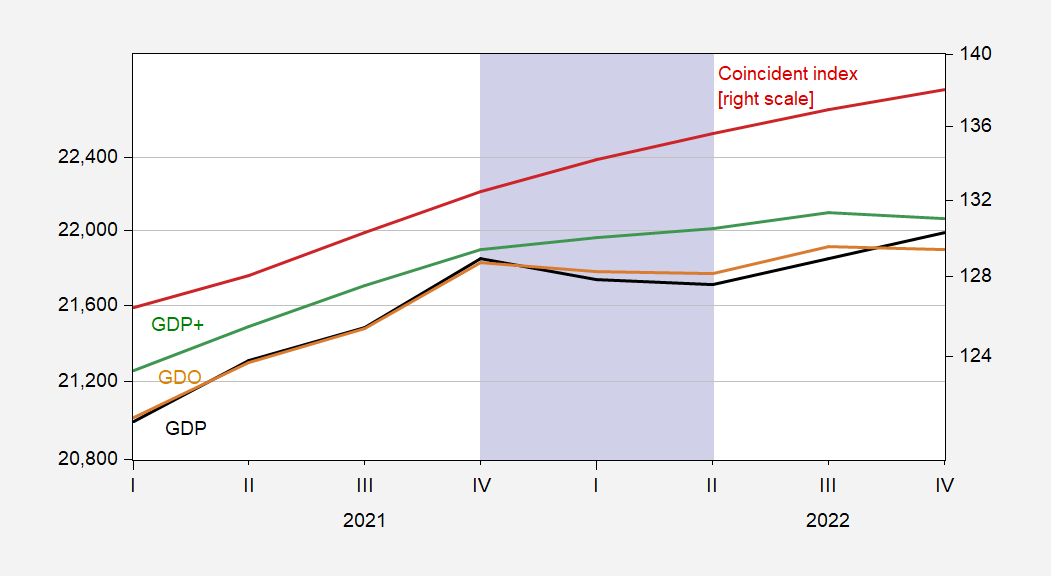
Figure 2: GDP (black, left scale), GDO (tan, left scale), GDP+ (green, left scale), all in bn.Ch.2017$ SAAR, and coincident index (red, right scale). Putative peak-to-trough recession of 2022H1 shaded lilac. Source: BEA via FRED, Philadelphia Fed.
What about the James Hamilton markov switching model for recession definition, given the decline in GDP in 2022Q1-Q2?
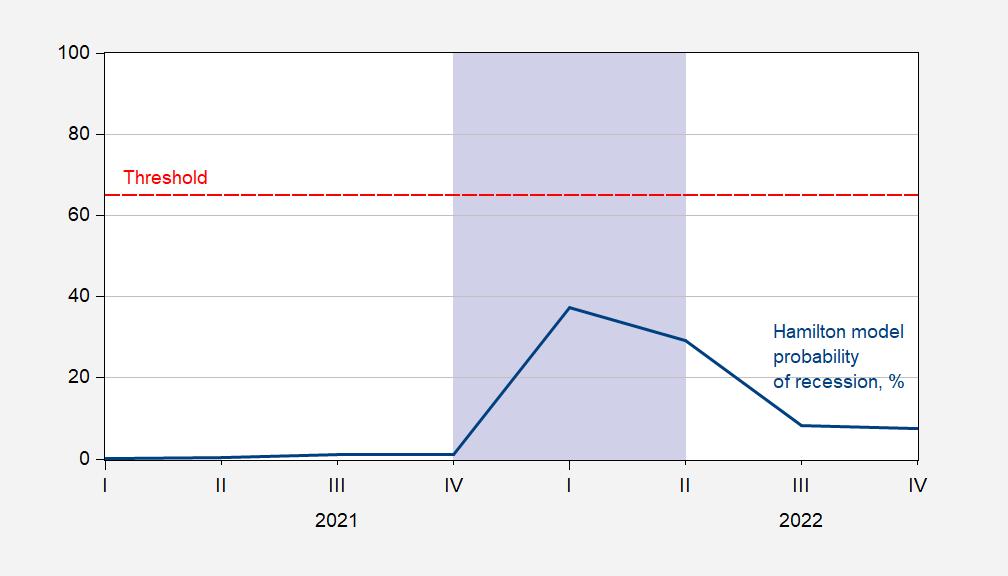
Figure 3: Probability of being in a recession, from James Hamilton model, in %. Threshold denoted by red dashed line. Putative peak-to-trough recession of 2022H1 shaded lilac. Source: FRED.
The indicator remains far below the threshold.
What about the Sahm rule (real time)?
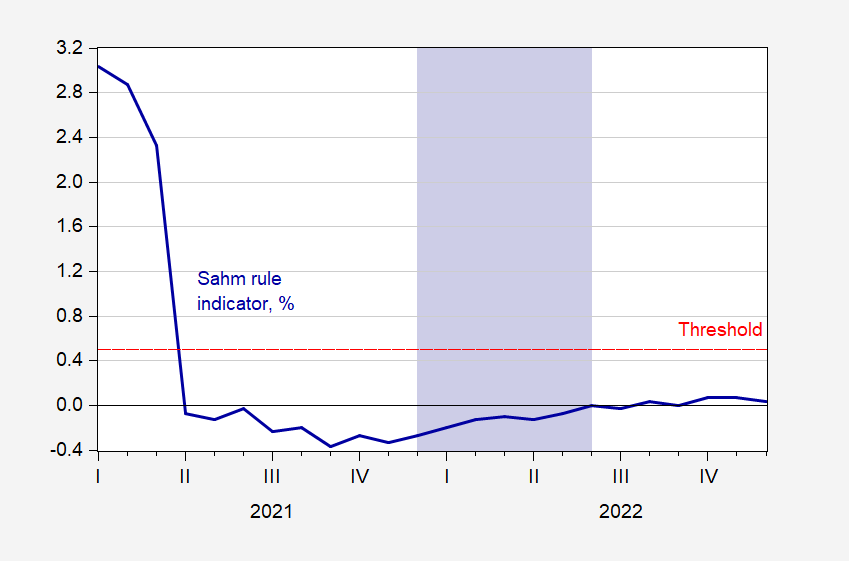
Figure 4: Real time Sahm rule indicator, in % (blue). Threshold denoted by red dashed line. Putative peak-to-trough recession of 2022H1 shaded lilac. Source: FRED.
This indicator was also very far below the threshold.
Finally, Mr. Kopits cited two series as supportive of his recession thesis. Unfortunately, neither are very predictive of recessions as defined by NBER’s Business Cycle Dating Committee.
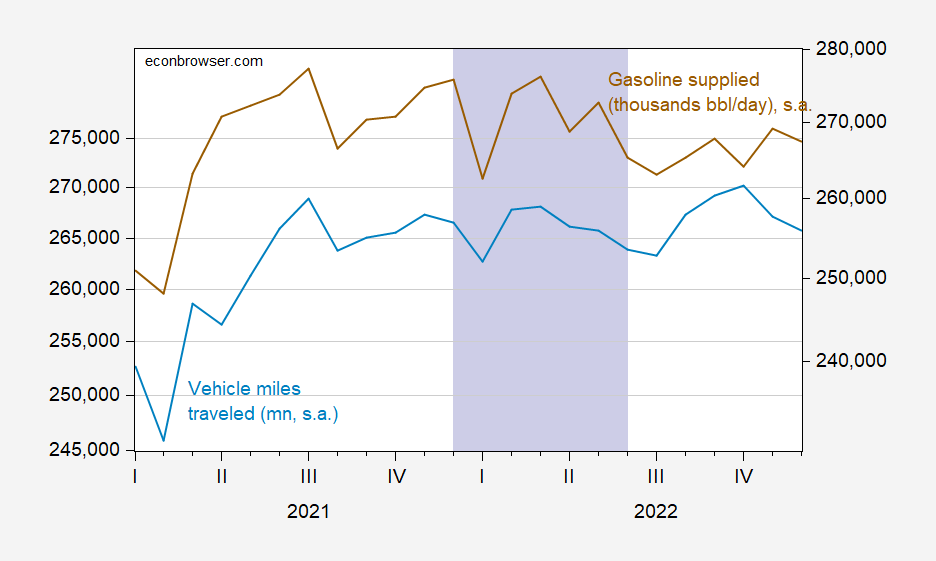
Figure 5: Vehicle miles traveled, mn., s.a. (light blue, left scale), gasoline supplied, thousands bbl/day (brown, right scale). Gasoline supplied seasonally adjusted by author using X-13 (in logs). Putative peak-to-trough recession of 2022H1 shaded lilac. Source: NHTSA via FRED, EIA, and author’s calculations.
Remember, Mr. Kopits wrote as recently as September 2023:
I am pretty comfortable with both my H1 2022 call and with the role of gasoline/diesel consumption and VMT as indicators of economic stress or comfort, as the case may be. I’d note that US oil and gas consumption remains depressed by about 5% compared to normal but hasn’t changed much in the last year or so.
Wow!
More By This Author:
GDPNow Vs. WSJ July ForecastRecession Predictions From Six Months Ago
Recession Indicator Sit-Rep


Comments
Log in or sign up to join the conversation.