A Search For A Phillips Curve In China
I wondered whether Chinese inflation behavior was anomalous.

Answering that question depends critically on (1) what model you believe in, (2) what you believe the model parameters are, (3) what you think the input values are, and (4) whether you think the model has been stable over time. Here’s one answer.
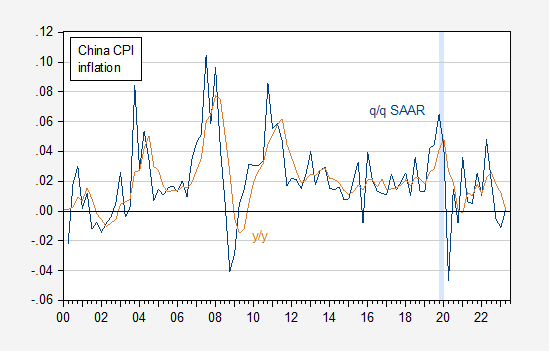
Consider the evolution of CPI inflation in China.
Figure 1: Quarter-on-quarter Chinese CPI inflation (blue), year-on-year (tan), calculated as log differences. ECRI defined recession dates shaded light blue. CPI adjusted using X-13. Source: World Bank.
This is the CPI series published by Kose and Ohnsorge at World Bank. The quarter on quarter series is seasonally adjusted using X-13 in levels, and then log differences calculated. The year-on-year series is the seasonally unadjusted series calculated using log differences.
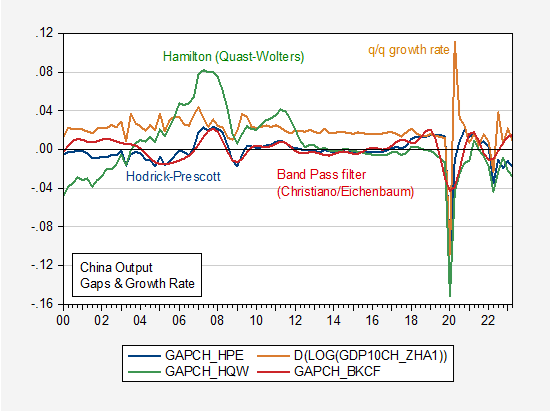
Can the evolution of Chinese inflation be explained by a Phillips curve, either pre-pandemic or post? In order to answer this question, one would need a measure of the output gap, or some other measure of economic activity. Figure 2 shows three output gaps, measured using statistical methods, and the growth real of real GDP.
Figure 2: HP filtered GDP on extended sample (blue), band pass filter (Eichenbaum-Christiano) on extended sample (red), Hamilton filtered (Quast-Wolters) (green), and quarter-on-quarter GDP growth (tan). Source: GDP from Higgins & Zha/Atlanta Fed, author’s calculations.
- Hodrick Prescott is filter applied to GDP data extended 2 years using an ARIMA(1,1,0) to account for end of sample estimation problems associated with two-sided filter.
- Band Pass filter is applied to same extended GDP time series.
- Modified Hamilton filter is the Jim Hamilton filter setting h=4 to 12 instead of 8 following Quast and Wolters (2023)
- Growth rate is annualized q/q growth rate of GDP.
GDP data is Higgins and Zha (Atlanta Fed) data updated from 2018Q1 using actual reported growth rates reported by NBS.
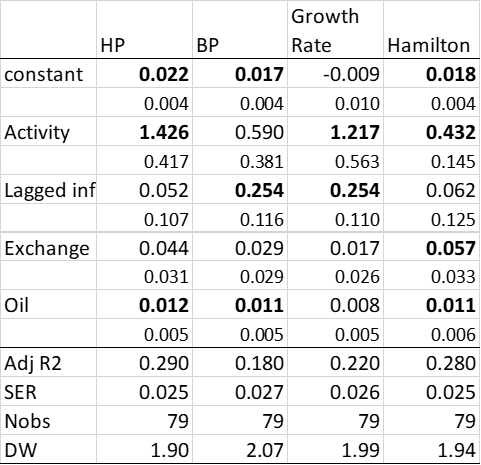
I run a regression of q/q annualized inflation on lagged output gap/growth rate measure, lagged trade weighted nominal exchange rate depreciation, and contemporaneous change in oil price in CNY over the 2000Q1-19Q3 period.
πt = β + βgapt-1 + γ πt-1 + φ Δqt + φΔptoil
The estimates are in Table 1.
Table 1: Chinese Inflation Rate Determinants
Notes: Bold denotes significance at 10% using HAC robust standard errors.
Notice the gap (or growth rate) is usually significant (exception is band pass filter), while lagged inflation is only significant when using the modified Hamilton filter. Oil prices always significant.
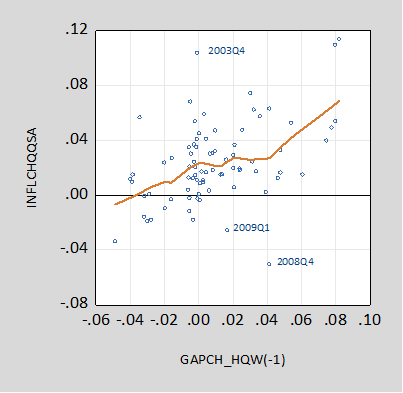
Here’s a scatterplot of inflation (q/q AR) vs. Hamilton (modified) gap, 2000Q1-19Q3:
Figure 3: Quarter-on-quarter annualized inflation vs. lagged gap (Hamilton filter).
Using these estimates, I predicted the inflation rates (note the inflation rate shown below does not match those reported in the press because they are seasonally adjusted q/q rates). This is a test of how stable the estimated regressions are in the post-Covid period.
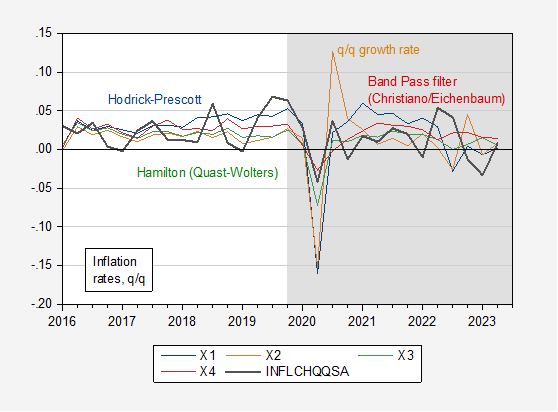
Figure 4: Actual q/q inflation (black), prediction using HP filter (blue), using BP filter (red), using Hamilton filter (green), and using growth rate (tan).
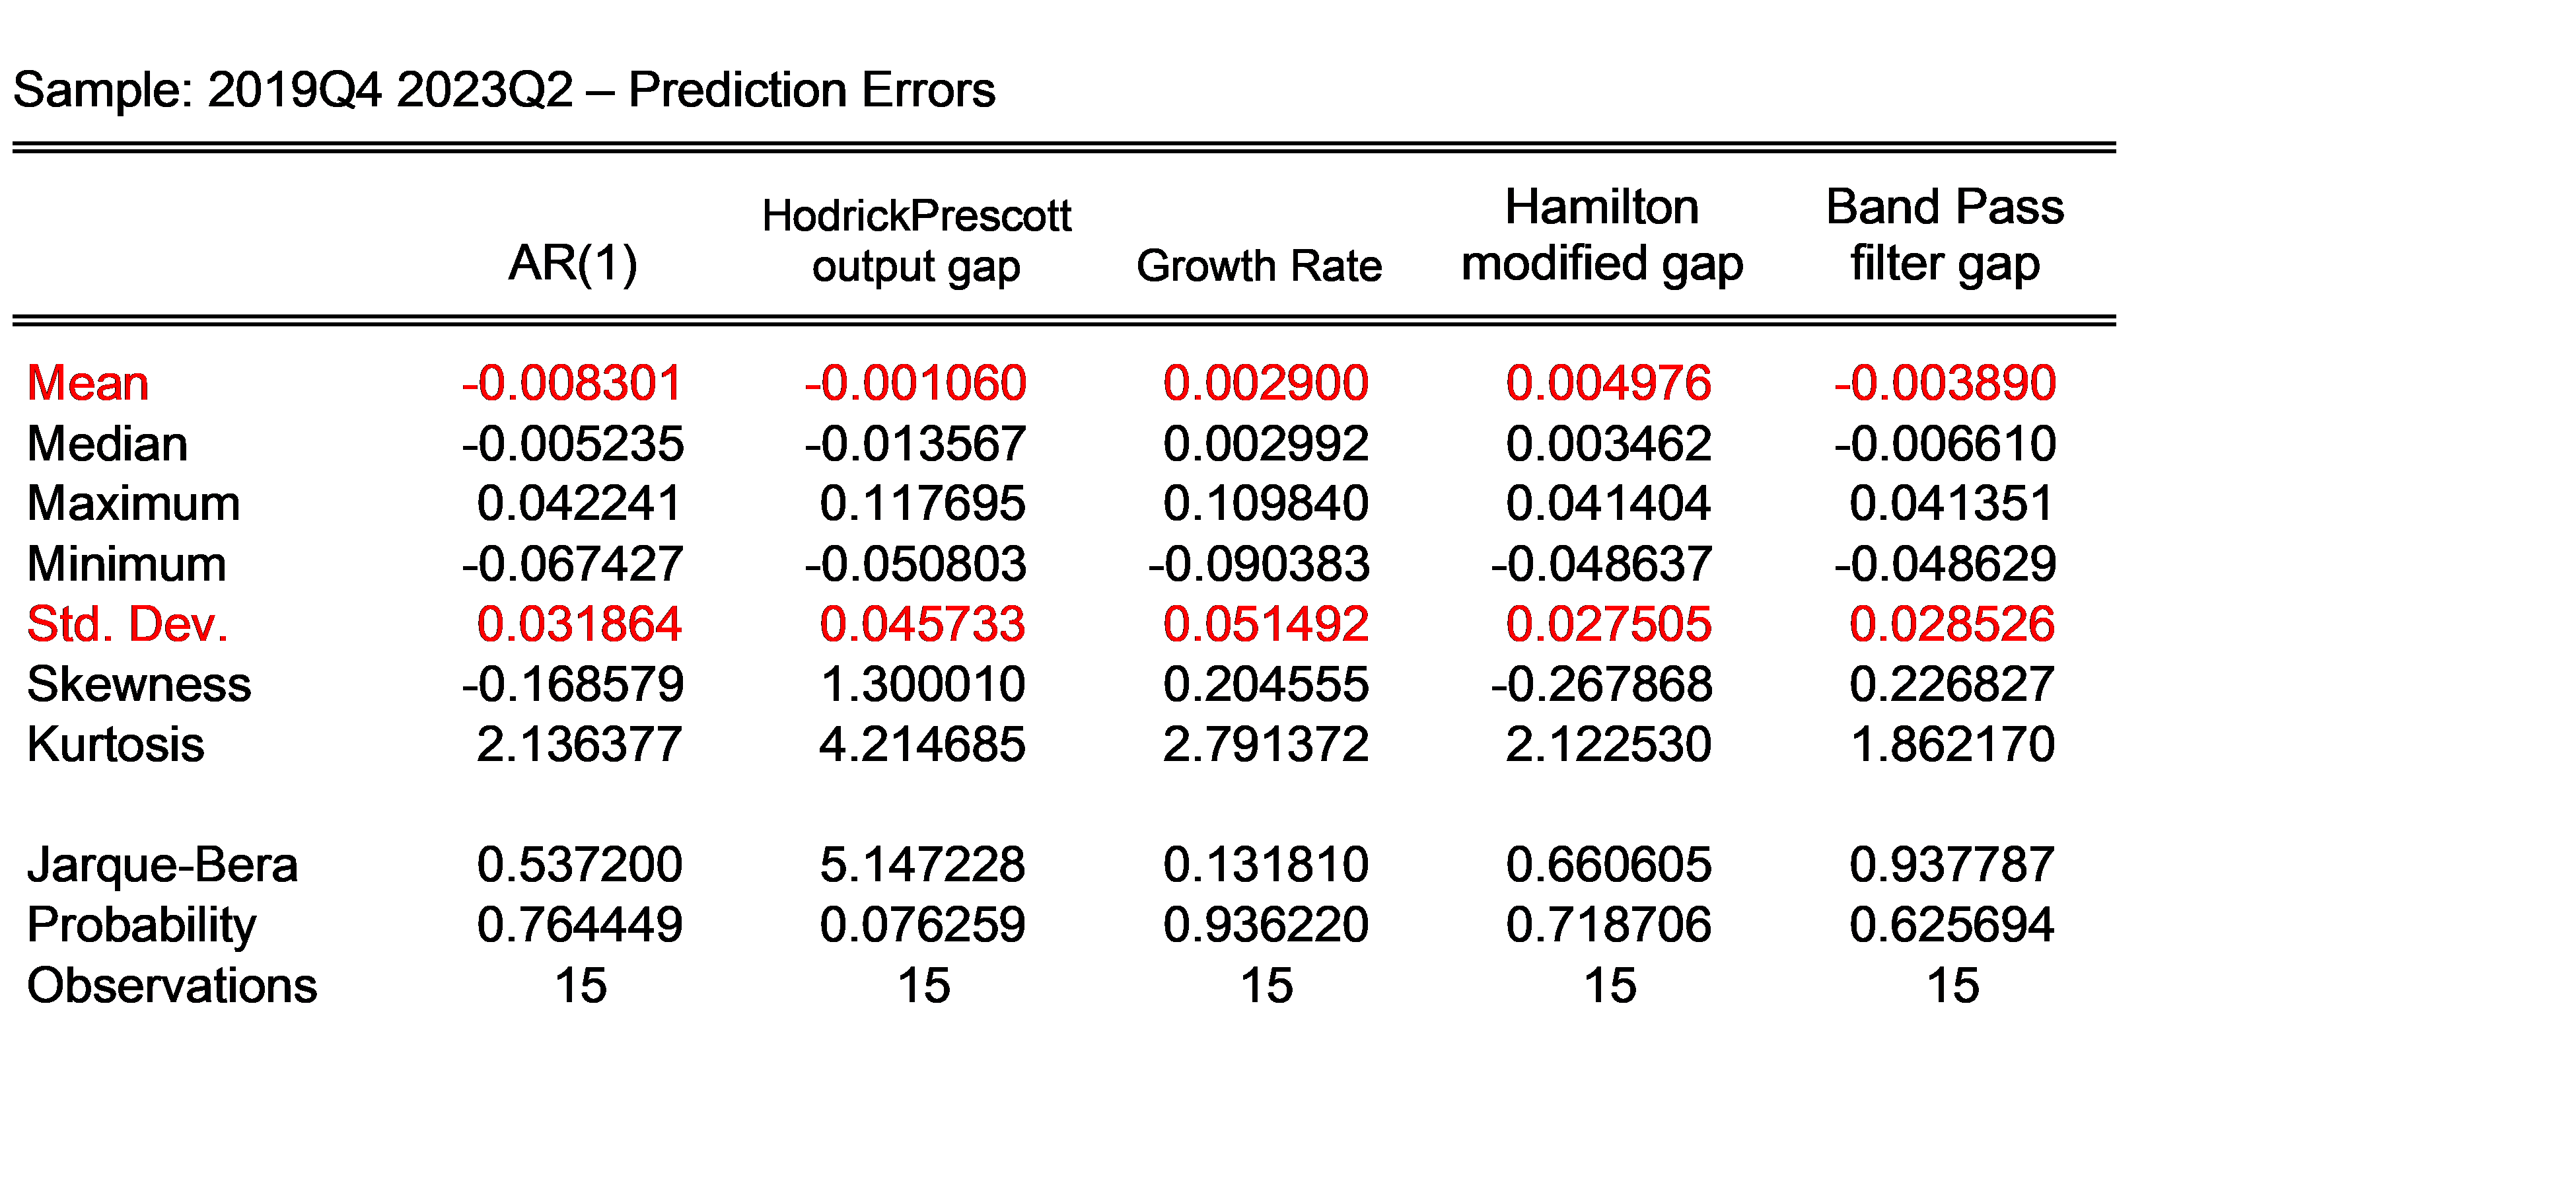
The Hamilton filter based output gap yields the lowest root mean squared error (but underpredicts the most).
Table 2: Actual minus predicted
Short summary
Measures of economic activity are positively associated with inflation, after accounting for cost push shocks (particularly oil shocks). Lagged inflation doesn’t usually enter.
More By This Author:
GDP, GDI, GDO, GDP+Growth Prospects: July WSJ Survey
Business Cycle Indicators At Mid-July 2023

