
Industrial production surprises on the downside (-0.5% vs. 0% Bloomberg consensus m/m), as does manufacturing (-0.3% vs. 0% m/m). Here’s the picture of key indicators followed by the NBER BCDC, along with monthly GDP (SPGMI), as well as GDPNow (Q2 up by 10 bps relative to 7/10).
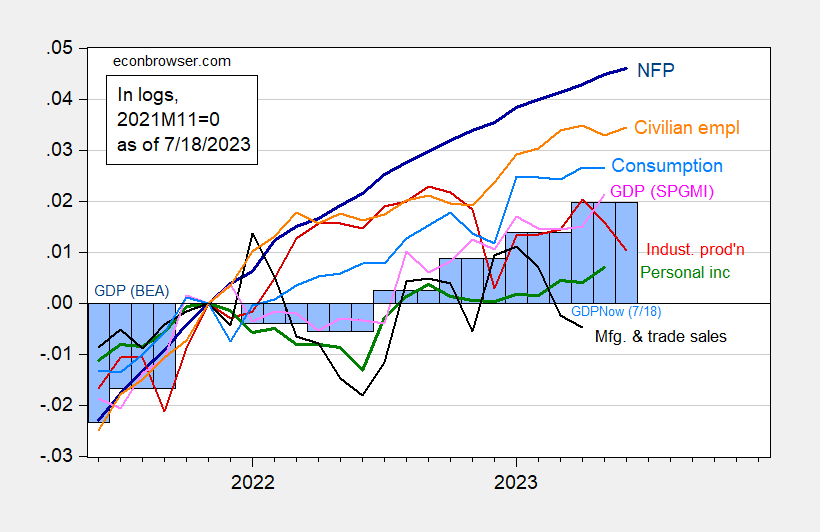
Figure 1: Nonfarm payroll employment, NFP (dark blue), civilian employment (orange), industrial production (red), personal income excluding transfers in Ch.2012$ (green), manufacturing and trade sales in Ch.2012$ (black), consumption in Ch.2012$ (light blue), and monthly GDP in Ch.2012$ (pink), GDP (blue bars), 2023Q2 is GDPNow of 7/18, all log normalized to 2021M11=0. Source: BLS, Federal Reserve, BEA 2023Q1 3rd release via FRED, Atlanta Fed (7/18), S&P Global/IHS Markit (nee Macroeconomic Advisers, IHS Markit) (7/3/2023 release), and author’s calculations.
GDPNow for Q2 at 2.4% SAAR as of today. GS at 2.5%, while SPGMI at 1.7%.
Retail sales were generally under consensus. Here’re time series of industrial production, manufacturing production, and retail sales deflated by final demand/finished goods PPI, over the same period shown in Figure 1.

Figure 2: Industrial production (red, left log scale), manufacturing production (purple, left log scale), and retail sales ex-food services deflated by PPI final demand finished goods, millions 1982$ (green, right log scale), all seasonally adjusted. Source: Federal Reserve, Commerce Department, BLS all via FRED, and author’s calculations.
More By This Author:
China Upside Surprise
Consumer Sentiment: Less “Meh”
“It Was The ‘Meh’ Of Times. It Was The Worst Of Times…”


Comments
Log in or sign up to join the conversation.