
The slowdown keeps on being moved back — according to consensus — to Q4. Mean forecast is for only one quarter of negative growth, but median has two (Q3, Q4).
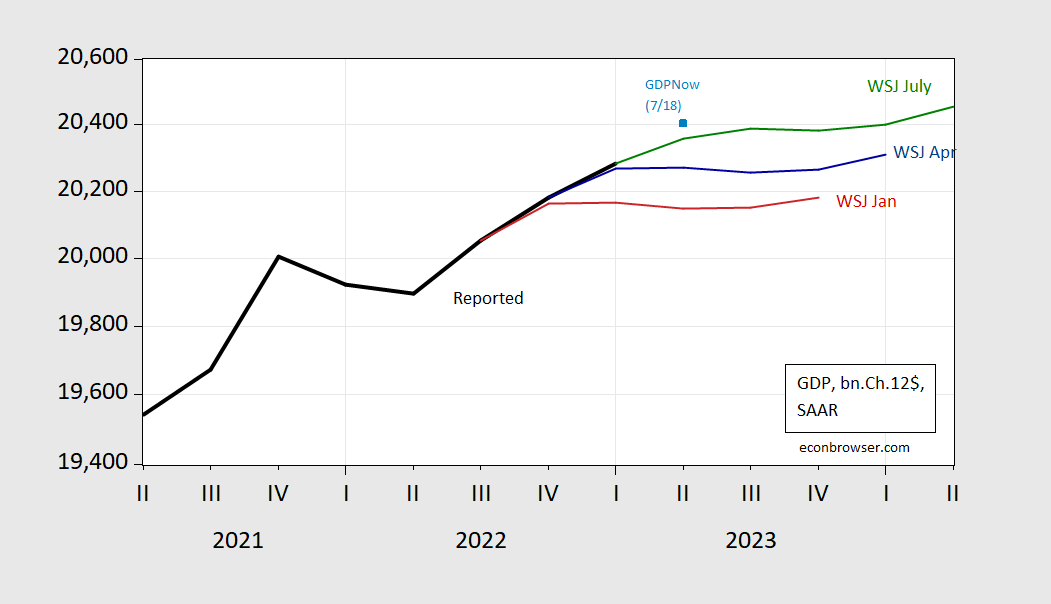
Figure 1: GDP (black), Mean forecast GDP from July WSJ survey (green), from April survey (blue), from January survey (red), GDPNow nowcast of 7/18 (light blue square), all in bn.Ch.2012$ SAAR. Source: BEA, WSJ surveys (various), and author’s calculations.
While the mean forecast trajectory keeps on rising as actual GDP outcomes keep on surprising on the upside, forecasts are pretty dispersed, as shown in Figure 2.

Figure 2: GDP (black), Mean forecast GDP from July WSJ survey (green), median of Price/Ameriprise Financial (pink), 20% trimmed high of Feinup, Hamilton/Cal Lutheran Univ. (gray), trimmed low of Fratantoni/Mortgage Bankers Association (gray), GDPNow nowcast of 7/18 (light blue square), all in bn.Ch.2012$ SAAR. Source: BEA, WSJ surveys (various), and author’s calculations.
The 20% trimmed high indicates 1.5% average annualized growth over the next 5 quarters (mean/median foreast is 0.68%/0.66%). The trimmed low is 0.46% Note that the sample high forecast (the irrepressible James F. Smith, now of EconForecaster) was 3%(!).
Recession probabilities from the survey, contrasted with term spread based estimates — discussed in this post.
More By This Author:
Business Cycle Indicators At Mid-July 2023China Upside Surprise
Consumer Sentiment: Less “Meh”


Comments
Log in or sign up to join the conversation.