

Image Source: Pexels
CBO projection and SPF mean forecast diverge, by nearly a percentage point in 2024.
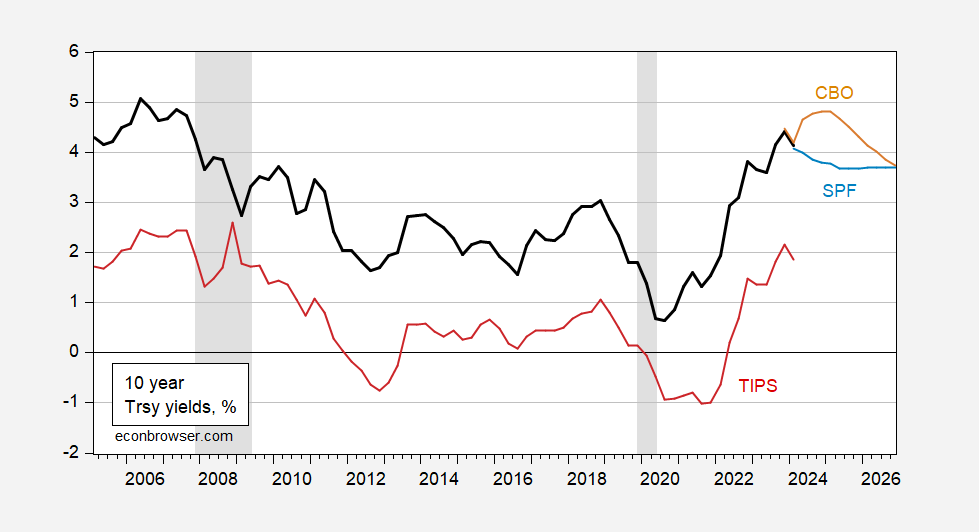
Figure 1: Ten year Treasury yield (black), projected by CBO (tan), SPF mean (blue), TIPS ten year (red), all in %. NBER peak-to-trough recession dates shaded gray. Source: Treasury via FRED, CBO, Philadelphia Fed, NBER.
CBO’s projection is based on current law, while the various forecasters in the SPF are not similarly constrained. That, I think does not explain the difference.
The implications for interest payments (hence total vs. primary deficit) differ as a consequence.
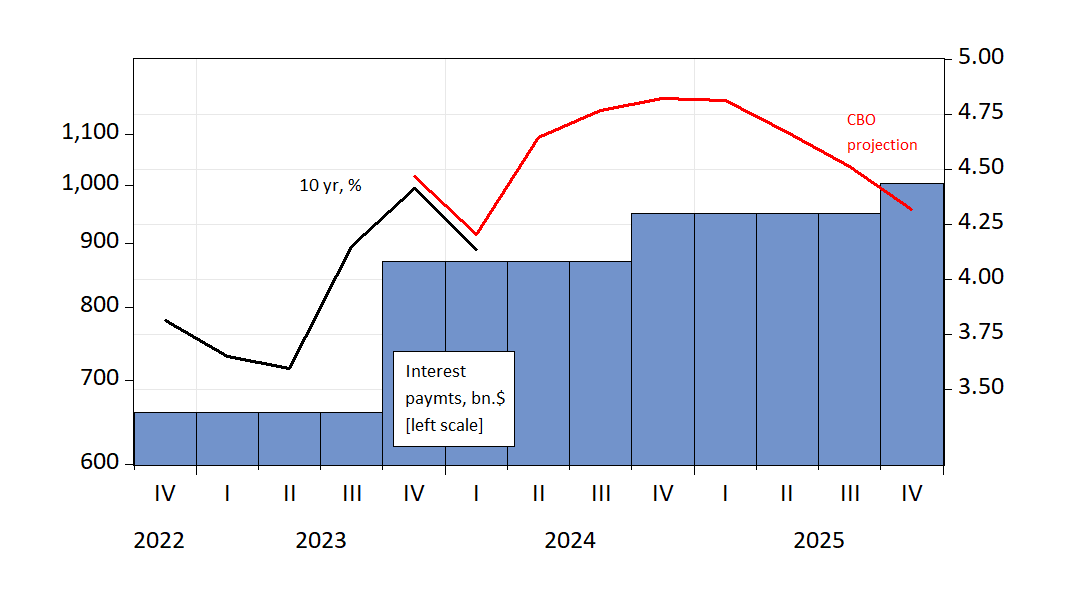
Figure 2: Federal interest payments in bn.$, SAAR (blue bar, left log scale), and ten year Treasury (black), and CBO projection (red), both in % (right scale). 2024Q1 is for January-February. Source: CBO, Treasury via FRED.
More By This Author:
Business Cycle Indicators, End-February 2024GDP, Est’d GDO, GDP+
The UK In Recession? Expected Or Unexpected?


Comments
Log in or sign up to join the conversation.