

Image source: Pixabay
Personal spending comes in at consensus, personal income above. Here’s a picture of key indicators followed by the NBER Business Cycle Dating Committee plus monthly GDP.
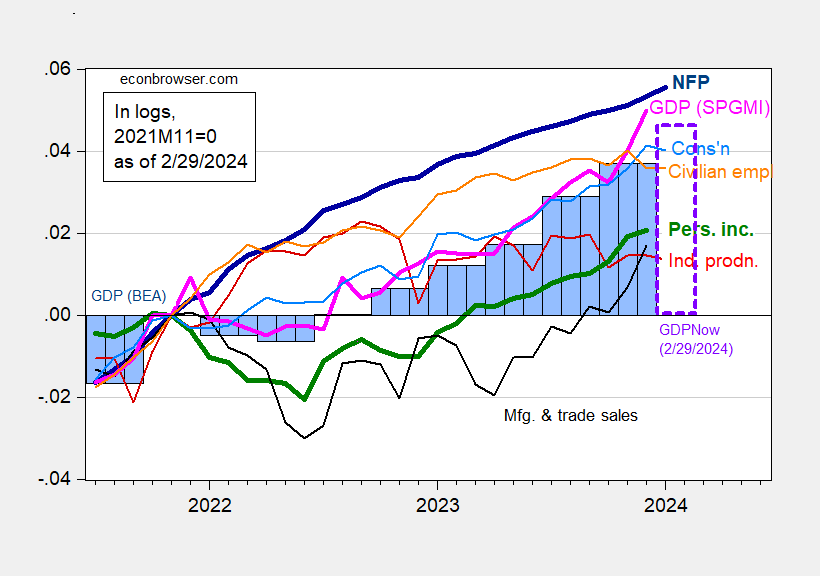
Figure 1: Nonfarm Payroll employment (bold dark blue), civilian employment (orange), industrial production (red), personal income excluding current transfers in Ch.2017$ (bold green), manufacturing and trade sales in Ch.2017$ (black), consumption in Ch.2017$ (light blue), and monthly GDP in Ch.2017$ (pink), GDP, 2nd release (blue bars), GDPNow for 2024Q1 as of 2/29 (lilac box), all log normalized to 2021M11=0. Source: BLS via FRED, Federal Reserve, BEA 2023Q4 2nd release, Atlanta Fed, S&P Global Market Insights (nee Macroeconomic Advisers, IHS Markit) (2/1/2024 release), and author’s calculations.
GDPNow for Q1 is 3.0% (q/q AR) as of today.
Here are some alternative indicators: heavy truck sales, coincident index, and vehicle miles traveled.

Figure 2: Heavy truck sales (blue), coincident index (tan), vehicle miles traveled, s.a. using X-13 (green), all in logs, 2021M11=0. Source: Census, Philadelphia Fed, NHTSA via FRED, and author’s calculations.
While vehicle miles traveled is trending sideways, it’s not a reliable predictor or coincident indicator of recession (see this post). Heavy truck sales – including the 12 month growth rate – is a good indicator. This measure is well outside of the recession zone. The coincident index from the Philadelphia Fed indicates no slowdown.
I’m hard pressed to see an ongoing recession in the December-January data.
More By This Author:
GDP, Est’d GDO, GDP+The UK In Recession? Expected Or Unexpected?
CFNAI For January, WEI For Mid-February


Comments
Log in or sign up to join the conversation.