
↵

Image Source: Pexels
- SPX Monitoring purposes; Sold 3/14/23 at 5150.48 = gain .52%; Long SPX 3/8/24 at 5123.69.
- Our Gain 1/1/23 to 12/31/23 SPX= 28.12%; SPX gain 23.38%
- Monitoring purposes GOLD: Long GDX on 10/9/20 at 40.78.
(Click on image to enlarge)
Our gain for 2023 came in at 28.12% and SPX gain for 2023 came in at 23.38. We made 8 SPX trades with one loss and 7 wins in 2023.
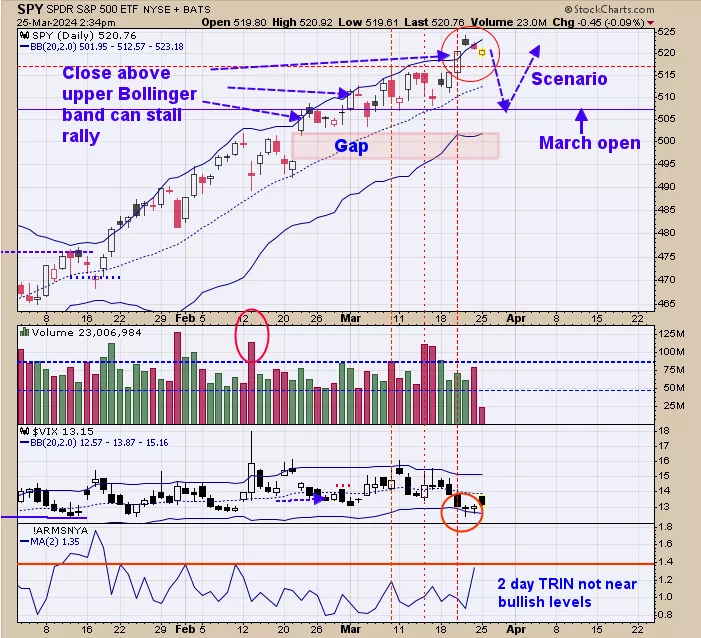
Short-term pullback can occur when the daily SPY closes above its upper Bollinger band. Last Wednesday and Thursday SPY closed above its upper Bollinger band. We pointed out previous times over the last several weeks when the SPY closed above its Bollinger band with blue arrows. These types of pullbacks can last several days but are usually not associated with large pullbacks. Page two commentary suggests the SPY could pull back to the beginning of March which is near the 507 range. It’s common for markets to pull back into the Holiday period and Friday is “Good Friday” a holiday.
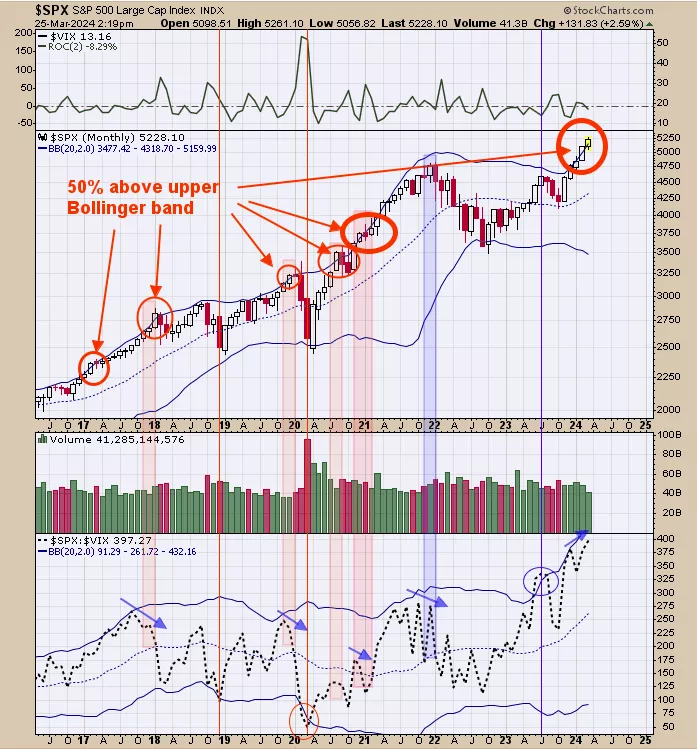
We have shown this chart before and are updated to current data. Above is the monthly SPX with its Bollinger bands. Normally when the monthly trading range closes half above its upper Bollinger band the next month is usually a consolidation month.February closed half is trading range above it’s upper Bollinger band suggests March (this month) could see a consolidation. There are three trading days to go for the month of March (Friday is Good Friday and markets are closed) and appears a pullback has started.Could see the next bullish setup occur early Next week. There can be “Back and Filling” this month but intermediate-term trend remains bullish. Could see the market rally another 10% or more before the year is out.”
(Click on image to enlarge)
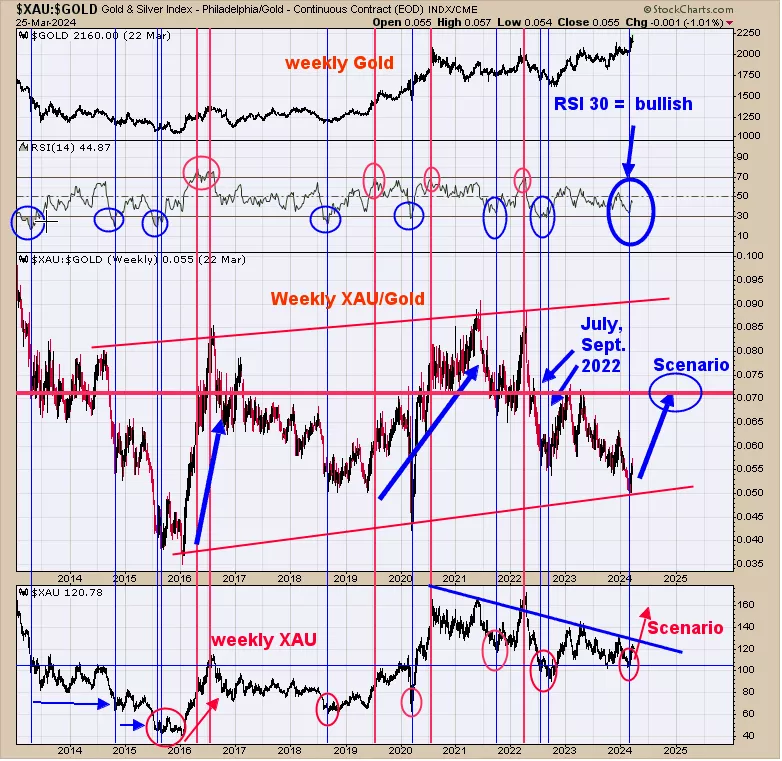
The middle window is the weekly XAU/Gold ratio and above that window is the RSI for this ratio. Intermediate-term lows form when the weekly RSI for the XAU/Gold ratio turns up from 30; which it did in late February or early March triggering a buy signal. We noted with blue lines on the weekly XAU chart (bottom window) the previous buy signals of this type. Most signals last several months if not longer. There is a good chance that the XAU could rally to July and possibly October. We noticed also when a signal is triggered the XAU/gold ratio rallies back to at least .07, and this will be the minimum upside target (the current XAU/Gold ratio stands at .055).
More By This Author:
All About The S&P
S&P 500 Remains Bullish
More Base Building Before The Strongest Rally Phase Begins?


Comments
Log in or sign up to join the conversation.