
SPX Monitoring purposes; Sold long 2/15/24 at 5029.73=gain 5.20%; Long SPX on 1/18/24 at 4780.94.
Our Gain 1/1/23 to 12/31/23 SPX= 28.12%; SPX gain 23.38%
Monitoring purposes GOLD: Long GDX on 10/9/20 at 40.78.
Our gain for 2023 came in at 28.12% and SPX gain for 2023 came in at 23.38. We made 8 SPX trades with one loss and 7 wins in 2023.
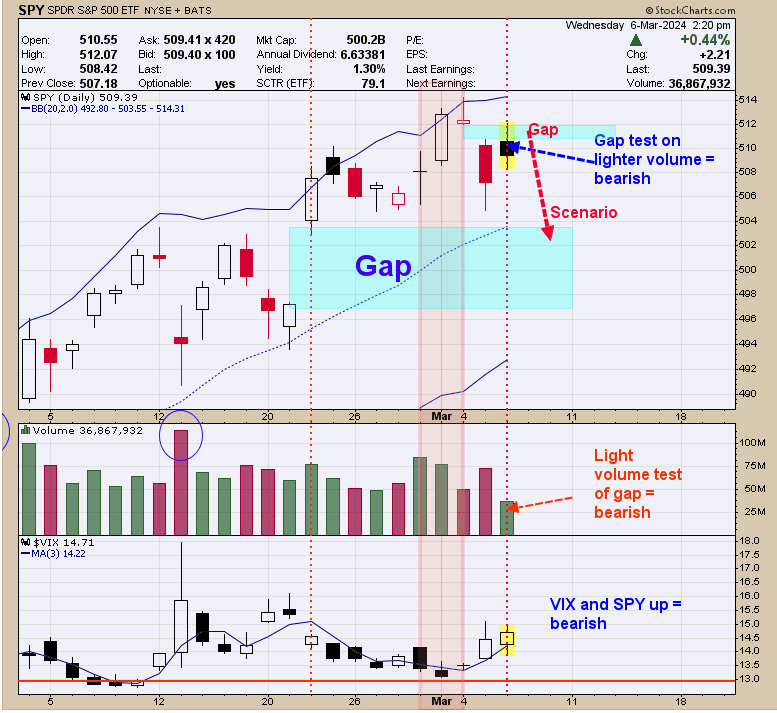
This is the week before option expiration week where whipsaws are common and so far that has been the case. Yesterday the SPY gapped down and today that gap was tested and the test came on lighter volume suggesting the gap has resistance. Today both the VIX and SPY where up which is a bearish sign. The evidence suggests the large gap (shaded in light blue) still may be tested near term. The gap test could setup a bullish signal if the gap test comes on lighter volume and panic from in the TRIN close with a reading above 1.20. Next week is option expiration week which has a bullish bias and is also the 8th strongest week of the year according to Seasonality.
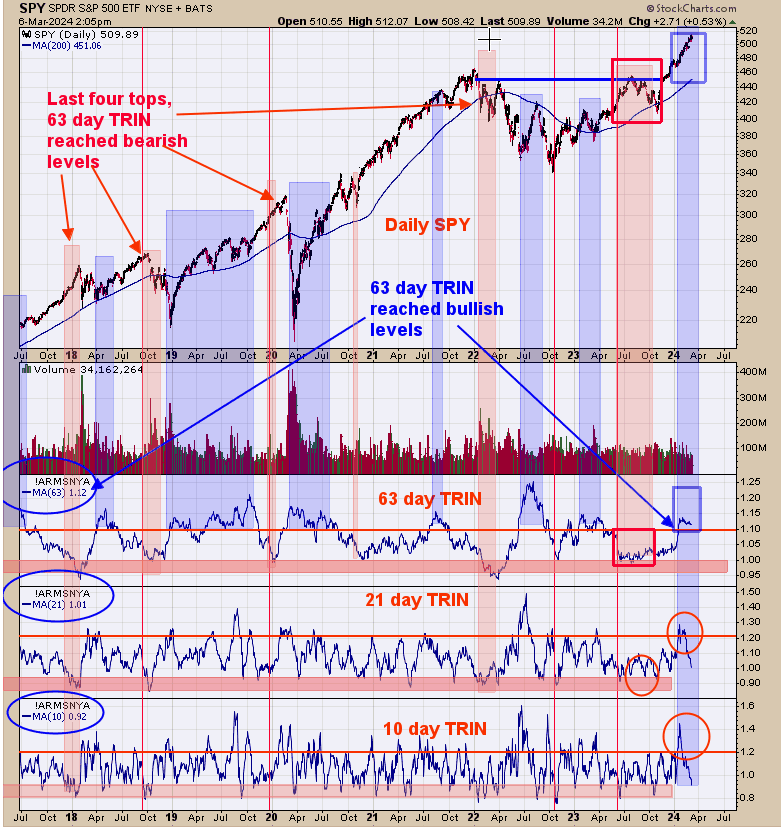
This chart looks at the bigger picture and remains bullish; what we said yesterday still applies, “The third window up from the bottom is the 63 day average of the TRIN. The 63 day average of the TRIN above 1.10 shows there is a worthwhile degree of panic in the market for a bullish outcome. The current 63 day TRIN reading comes in at 1.12. We noted those times shaded in blue. It’s when the 63 day TRIN trades near 1.00 and lower is when intermediate term tops can form which is shaded in light pink.”
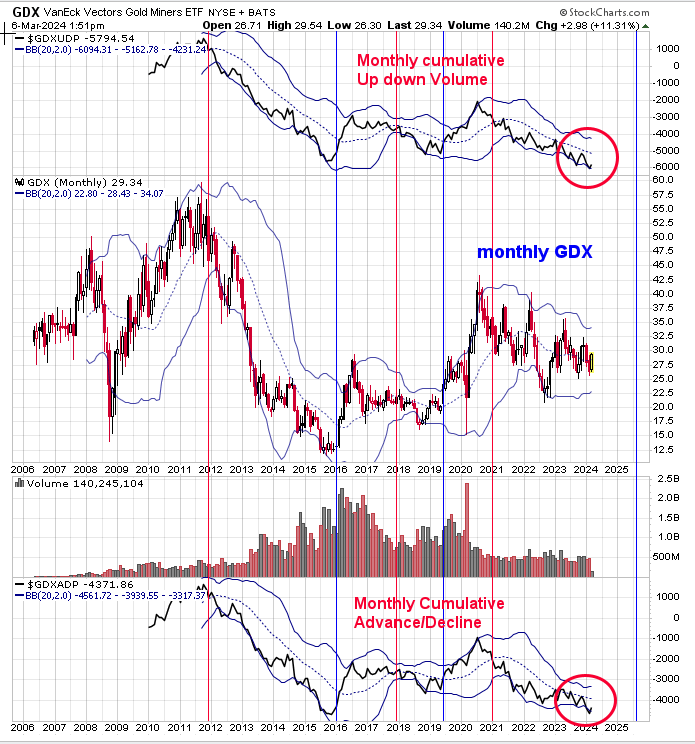
We present three different signals over the last few reports that triggered buy signals that can last several months. There could still be a base building process before the strongest rally phase begins. Having said that, the above chart is the one that matters on the longer term timeframe. The bottom window is the monthly GDX Advance/Decline percent with it’s Bollinger band and window above the month GDX window is the GDX Up Down volume percent with its Bollinger band. Multi-year signals are triggered when both indicators close above their mid Bollinger band; which you can see both haven’t. These type of signals lag the market; but can catch 80% of the move. The blue lines on the chart above are when both indicators closed above their mid Bollinger Band and red lines show when both indicators close below their Bollinger bands.
More By This Author:
"Selling Climaxes"Market Moods And The S&P 500
Bullish Sign


Comments
Log in or sign up to join the conversation.