Inflation Breakeven And Term Spreads Adjusted For Premia
Expected inflation inferred from the Treasury-TIPS spread is tainted by risk and liquidity premia. The difference between expected future short rates and current short rates is also obscured by risk premia. Here are adjusted spreads:
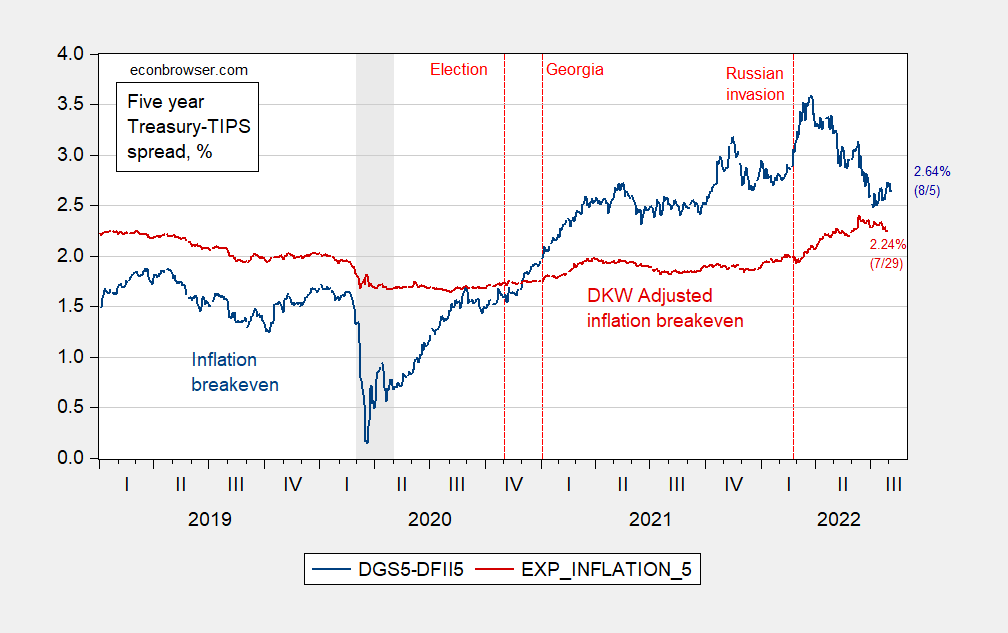
Figure 1: Five year inflation breakeven calculated as five year Treasury yield minus five year TIPS yield (blue, left scale), five year breakeven adjusted by inflation risk premium and liquidity premium per DKW (red, left scale), both in %. NBER defined recession dates shaded gray. Source: FRB via FRED, Treasury, NBER, KWW following D’amico, Kim and Wei (DKW) accessed 8/4, and author’s calculations.
The adjusted series suggests an upward movement in expected inflation with the expanded Russian invasion of Ukraine, but less than that indicated by the simple Treasury-TIPS spread (and no downward movement recently).
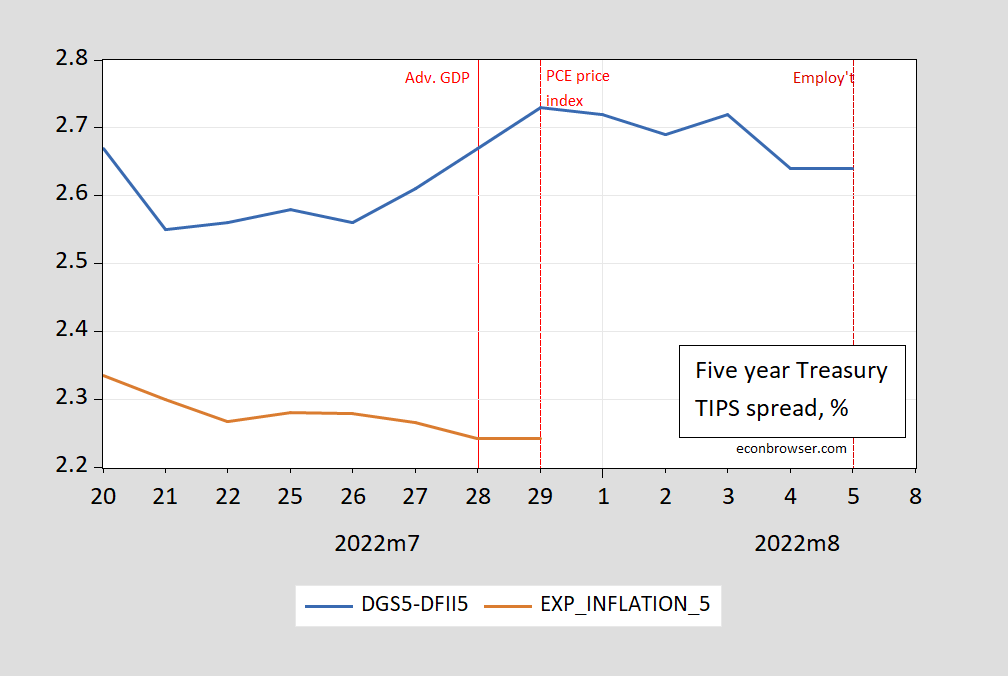
How have recent releases affected inflation expectations? Figure 2 presents a detail.
Figure 2: Five year inflation breakeven calculated as five year Treasury yield minus five year TIPS yield (blue, left scale), five year breakeven adjusted by inflation risk premium and liquidity premium per DKW (red, left scale), both in %. Source: FRB via FRED, Treasury, KWW following D’amico, Kim and Wei (DKW) accessed 8/4, and author’s calculations.
The inflation breakeven rises with the GDP advance and PCE deflator releases, but stays constant with today’s employment numbers (strangely). However, to the extent that the Treasury-TIPS spread mismeasures expectations, we should be a bit wary of this result (inflation expectations do drop with the GDP release with the adjusted measure).
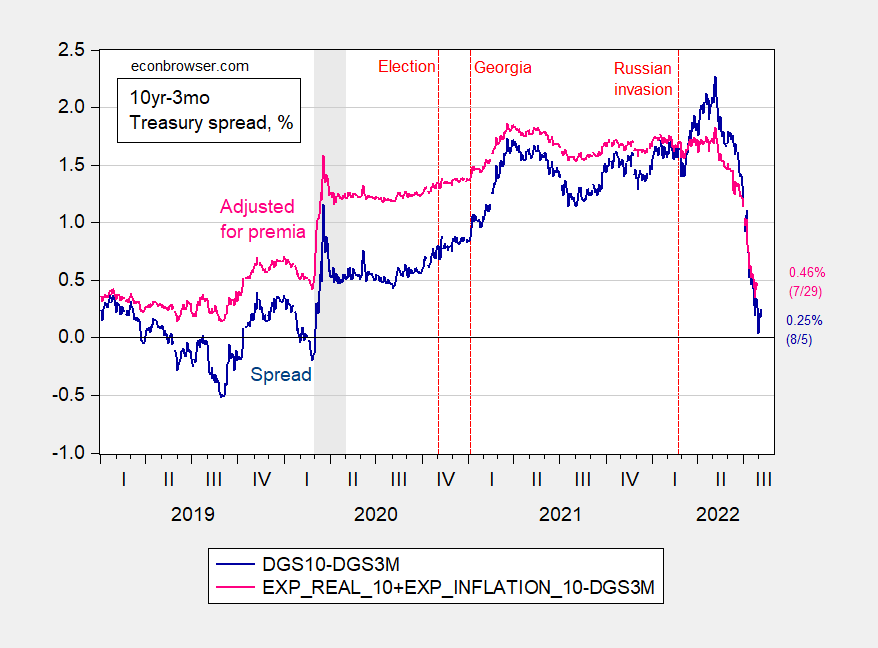
What about the 10yr-3mo spread? The unadjusted has taken a big dive in recent weeks, coming close to inversion.
Figure 3: 10 year-3 month Treasury spread (dark blue), and implied future nominal rates over next ten years (pink), both in %. NBER defined recession dates shaded gray. Source: FRB via FRED, Treasury, NBER, KWW following D’amico, Kim and Wei (DKW) accessed 8/4, and author’s calculations.
The gap between 10yr-3mo went negative in 2019, and again with the onset of the pandemic. The yield curve steepened sharply with the Georgia special election outcomes, and then counterintuitively rose again with the Russian expanded incursion into Ukraine. The spread dropped sharply from May 6th onward.
The spread incorporates a inflation risk premium so that on average, the yield curve slopes up. Hence, the standard 10yr-3mo spread does not necessarily equal the difference between 3 month yields over the next 10 years vs the current 3 month yield. I show the sum of the future 3 month real yields and future 3 month inflation rates over the next ten years as the pink line in Figure 2. This line probably better shows the heightened expectations of growth in 2021Q1-Q2, as well as the dropoff in perceived growth prospects in May.
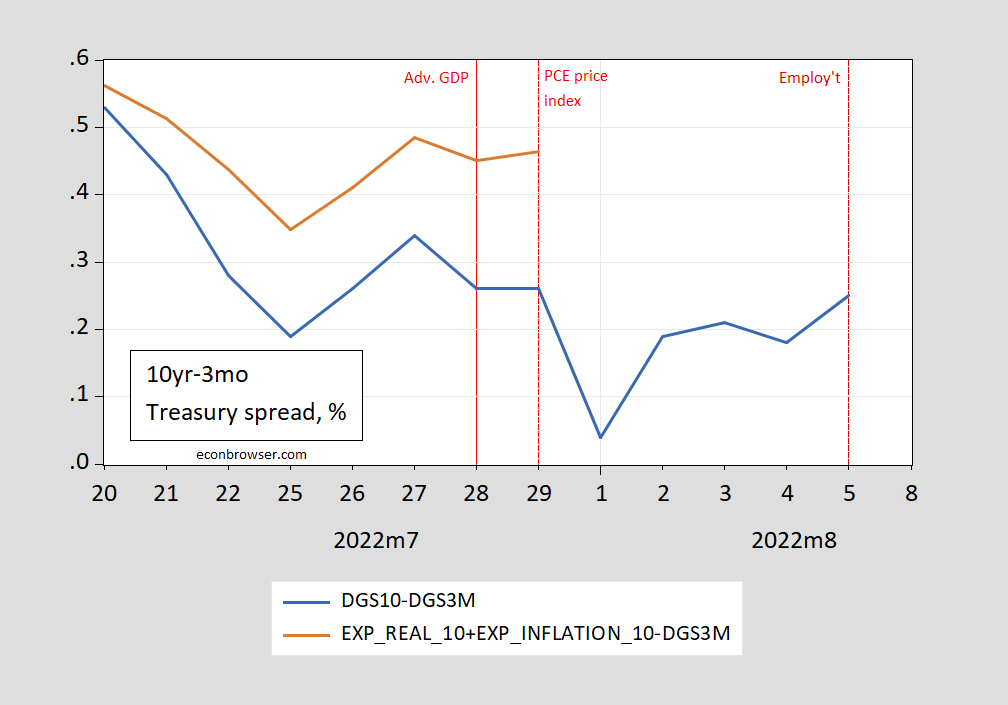
The detail suggests the expected asset price responses to the recent releases as well.
Figure 4: 10 year-3 month Treasury spread (dark blue), and implied future nominal rates over next ten years (pink), both in %. Source: FRB via FRED, Treasury, KWW following D’amico, Kim and Wei (DKW) accessed 8/4, and author’s calculations.
More By This Author:
So You Think We’re In A Recession As Of Mid-July?CBO Assessment On A Current Recessionary Environment
Heavy Truck Sales And Vehicle Miles Traveled Growth As Coincident Indicators
Disclosure: None.


