
Calculated Risk reminds me that heavy truck sales is something that collapses during recessions. I wondered how the 12-month change in this variable compare against the corresponding change in vehicle miles traveled (suggested by Steven Kopits). The latter does pretty lousy.
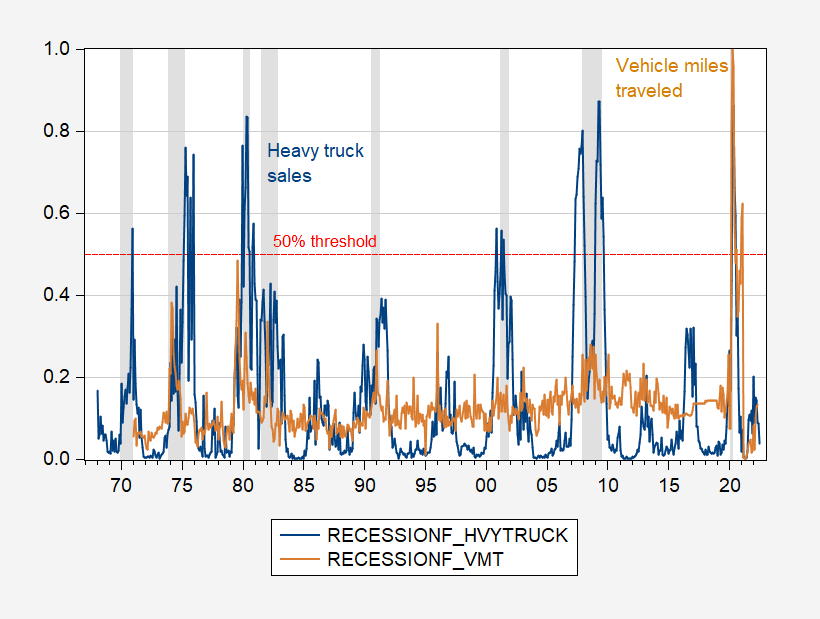
Figure 1: Recession probabilities using contemporaneous 12 month changes in heavy truck sales (blue), and in vehicle miles traveled (tan). 50% threshold dashed red line. NBER defined peak-to-trough recession dates shaded gray.
The McFadden R2 from the heavy truck regression is 28%, vs. 7% for vehicle miles traveled (VMT). One can also see quite simply using the 50% threshold the truck regression captures all the recessions from 1970 onward, with no false positives, while the vehicle miles regression will miss every recession except the 2020 unless an absurdly low threshold of 25% is used (in which case we have a false positive for 1995). The results barely change is one uses Kopits’s preferred measure, the change in the 12-month trailing moving average. Really, to be technical, VMT is a lousy coincident indicator of recession.
In neither case is there a recession indicated for May (13% for vehicle miles) or July (4% for heavy trucks) 2022 (latest data for vehicle miles and truck sales, respectively).
More By This Author:
Spreads Diverge As Inflation Breakeven DropsAdditional Perspective On The GDP Release
Business Cycle Indicators as of July 27


Comments
Log in or sign up to join the conversation.