

Image Source: Pixabay
We’re hours away from the NFL Super Bowl, but the all-day television coverage started sometime in the middle of the night. Watch all-day coverage, and by the time the game kicks off, you’ll know the name of the kicker’s dog, how a spelling bee in 2001 gave a backup running back the courage to play football, and the names of 47 phone apps on which you can bet money today.
I’m using Sunday to play catch-up after a long writing session yesterday. Let’s start today with what happened on Friday.
I had noted on Friday morning twice that we were moving into squeeze territory, and said I was looking for a squeeze during my morning show at 8:45 AM at TheoTrade. Why?
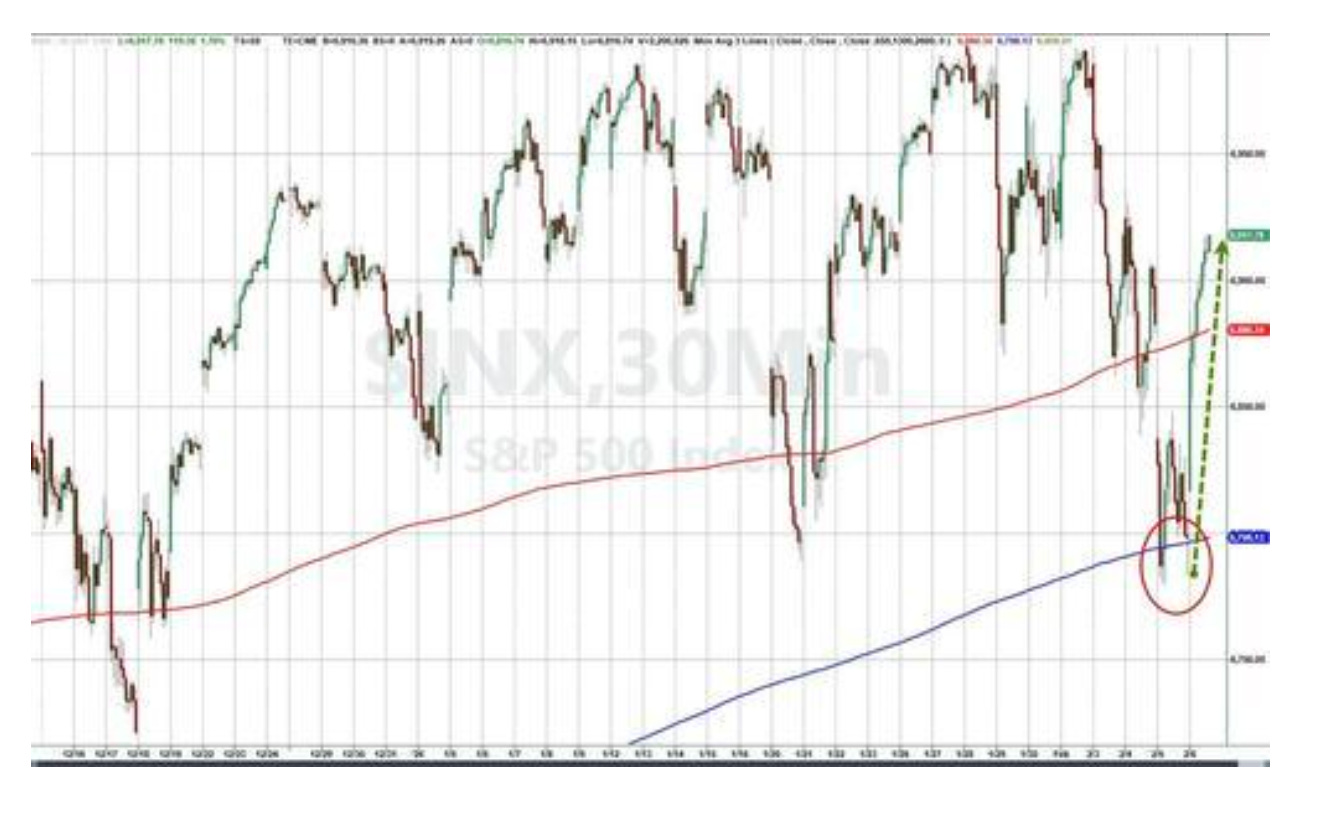
Well, in recent periods of Negative Momentum, we’ve seen the markets shake out excess leverage and test a key moving average. In this case, it was a tap on the 100-day moving average on Thursday night at 7:30 PM, around the time that Goldman Sachs (GS) said the software application beatings had run their course. Here’s the S&P 500 off that key moving average.
Source: ZeroHedge
Markets look for those moments. The squeeze brought us right back to equilibrium in terms of momentum.
This isn’t the first time that we’ve seen this happen. So, in the future (especially on a Friday with many options expiring), we must look for markets to course-correct. Let’s look at more charts.
Chart Of the Week: Japan Is Driving the Bus
MacroEdge has great content for those of us who love charts and screaming at laptops over global economics. From Friday’s briefing, this chart “defeats all man.” This is a U.S. AI ETF basically entangled in the sheets like lovers with Japan’s Nikkei.
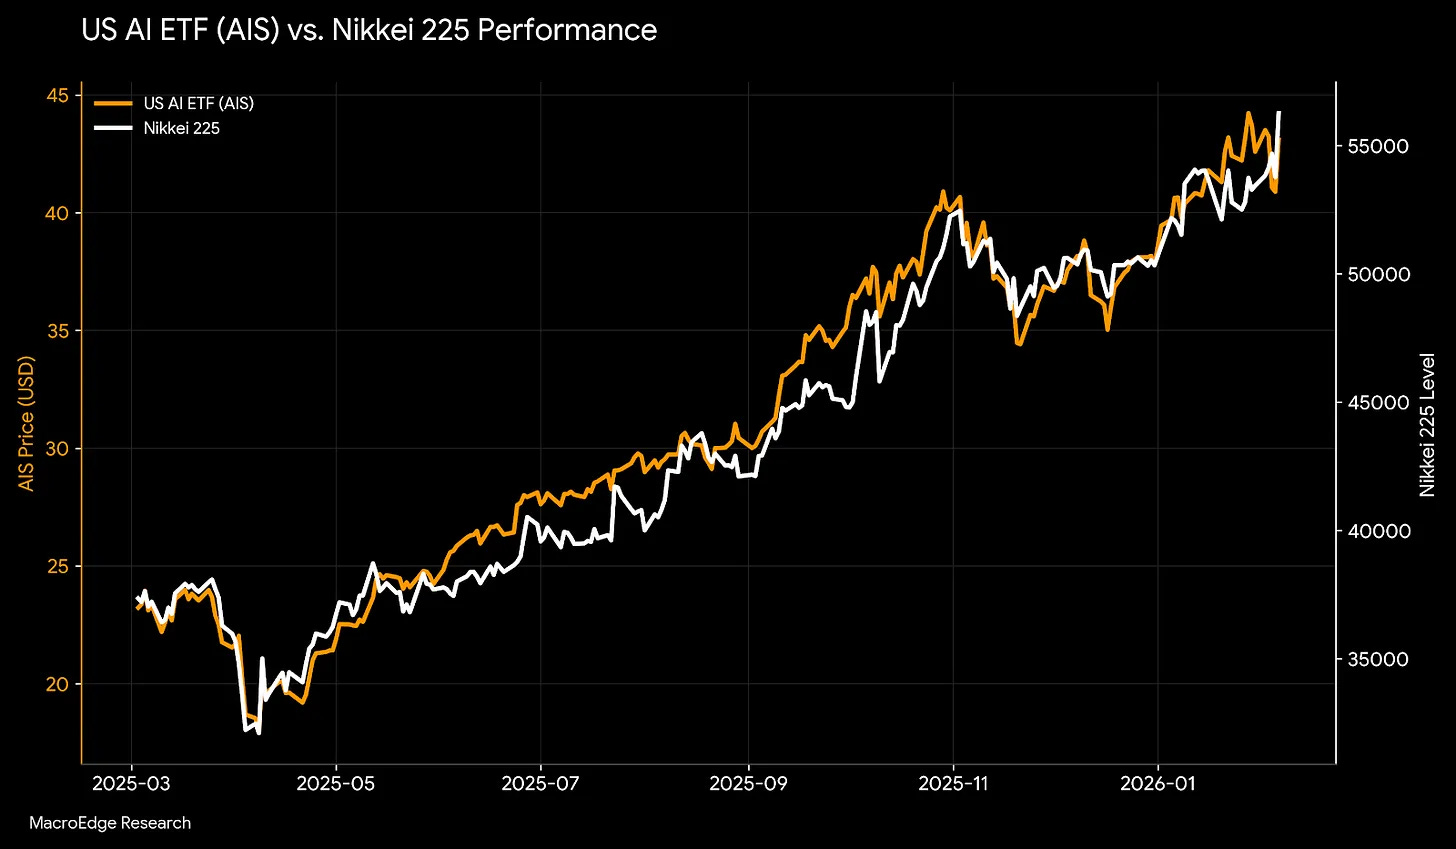
Image Source: MacroEdge Research
What’s going on here? Exactly what we’ve been warning about. The weaponized Japanese yen is funding the carry trade, which is funding the leverage in the AI trade. And as MacroEdge explains, “Bessent knows it. That’s why they keep pushing to weaken the yen.”
Gianni Di Poce at TheoTrade and I were talking about Japan the other day, and we noted that its bond market just had yet another once-in-1,000-year event. Why does this keep happening?
Because we aren’t prepared to deal with it, we keep stapling Frankenstein back together. Japan has been the primary driver of global funding woes since its market crash in August 2024. The U.S. and Japan did some emergency triage for SoftBank, and it’s becoming impossible to find a buyer for Japan’s debt.
Tack on that Japan's Prime Minister who wants to do more stimulus and run bigger deficits just won on Sunday, and we can anticipate some wild times ahead. We’ve been warning about this transmission mechanism since August 2024. When Japan sneezes, America catches pneumonia. They are joined at the hip, according to the Bank for International Settlements.
But get ready, things are about to get weird. Markets could absolutely surge tomorrow after the snap election produced a supermajority. It’s going to get really loud, really soon. We’ll check on the markets in the morning, especially after we moved back toward equilibrium fast on Friday.
As MacroEdge says, “When the yen carry trade finally breaks for good, the AI trade is going with it.”
Chart No. 2: One Bitcoin, Many Claims
Bitcoin went from $120,000 to $62,000 in four months. Everyone’s screaming, “Wall Street broke Bitcoin.” Did they?
James Lavish went to town on this one.
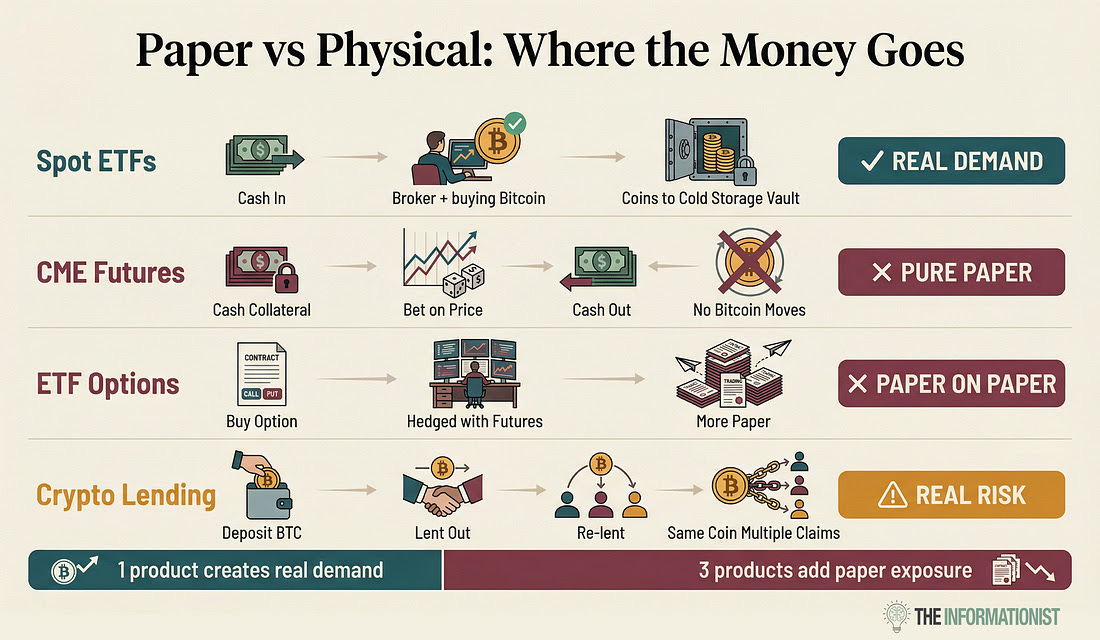
Image Source: The Informationist
This is another story about leverage. For every dollar of real Bitcoin trading, seven and a half dollars of paper Bitcoin traded alongside it.
For a long time, hedge funds ran a basis trade. They were long IBIT and short CME futures, and just pocketing the spread. Then they ran out of people to sell to. When it collapsed below the T-bill rate, they unwound. They sold the IBIT. That’s your “massive ETF outflows.”
It wasn’t panic, it was math. And again, another sign of financialization and engineering. This has been going on across a wide range of markets. This is also why our signal on momentum is so important. When it goes negative, wild things tend to happen pretty quickly in these markets.
Our last negative signal was on Jan. 28. Since then, gold and silver crashed, Bitcoin crashed, and we just had the worst momentum day in years. We certainly know how to combine liquidity and momentum.
As I’ve noted, BTC feels more like a place where funds can trade without much scrutiny. At least they’re not doing this with the food supply. They would, but BTC doesn’t offer any real friction. It’s a trade for leverage and momentum.
And when liquidity and momentum stall, it blows up. It’s almost like it’s designed for people who like playing with matches, so they set up a sandbox for pyromaniacs far away from everyone else just trying to invest in fundamentals. From time to time, the flames spread. But it’s usually contained.
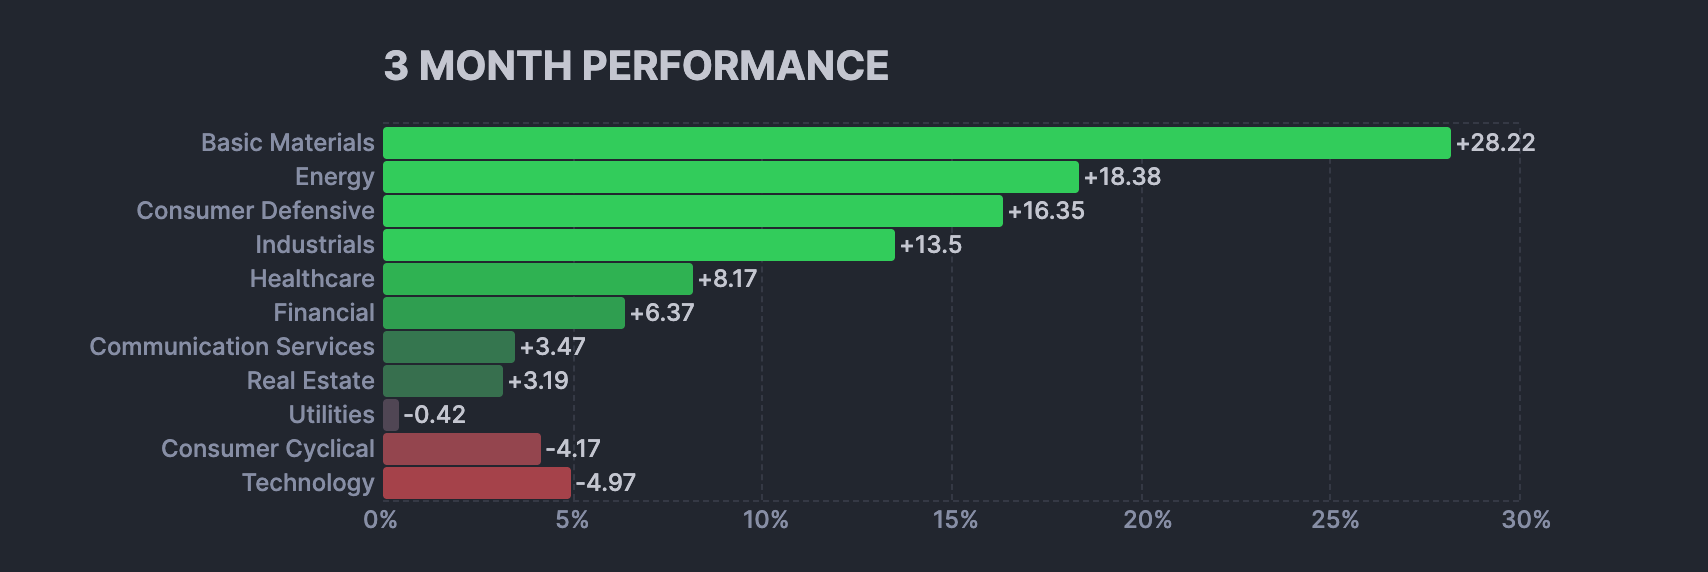
Over at All Star Charts, we find evidence of a common discussion we’re having. Liquidity might be at all-time highs, but high-flying momentum has broken down. Leverage around those big tech names, software, and BTC has unwound, all while money rotated into energy, materials, and consumer defensives.
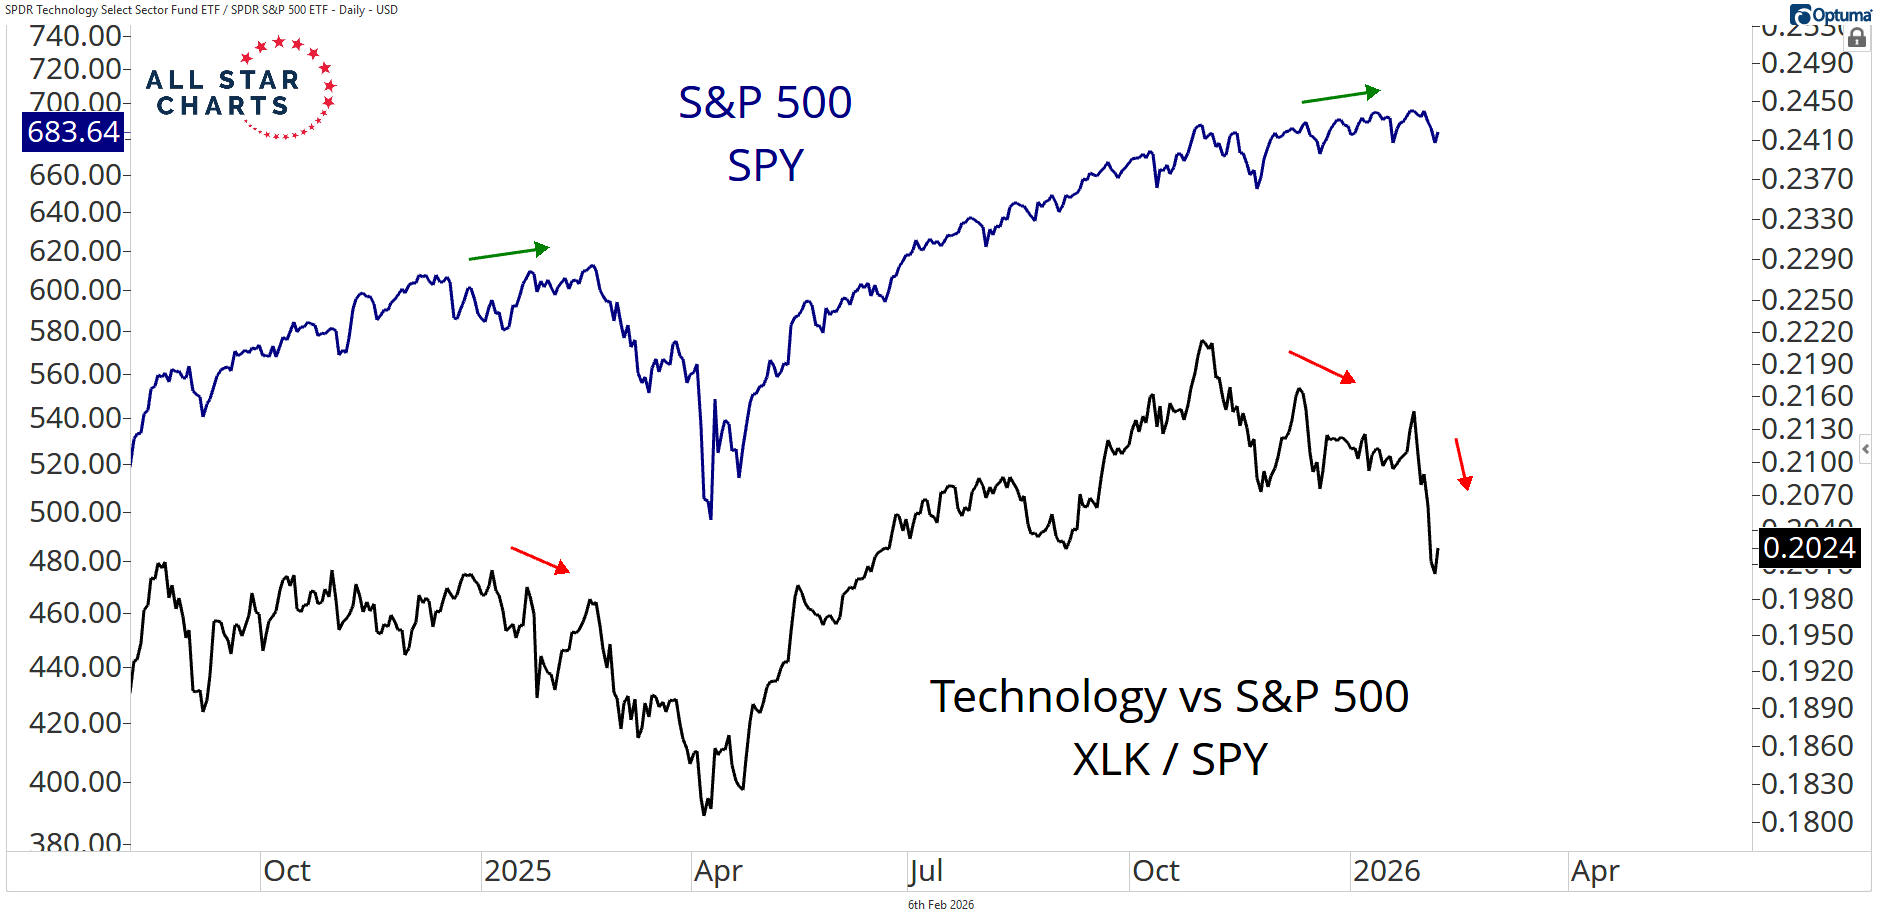
Image Source: All Star Charts
That rotation aligns with where we see capital moving throughout this cycle. I expect speculation will remain rampant around energy and materials in 2026. That’s common in this period, after the liquidity cycle starts to slow and then stalls.
Tack on the U.S.-China focus on raw materials from nations, and we could see wilder swings in anything not nailed down for the months ahead. Meanwhile, consumer defensives have remained strong.
(Click on image to enlarge)
Image Source: Finviz
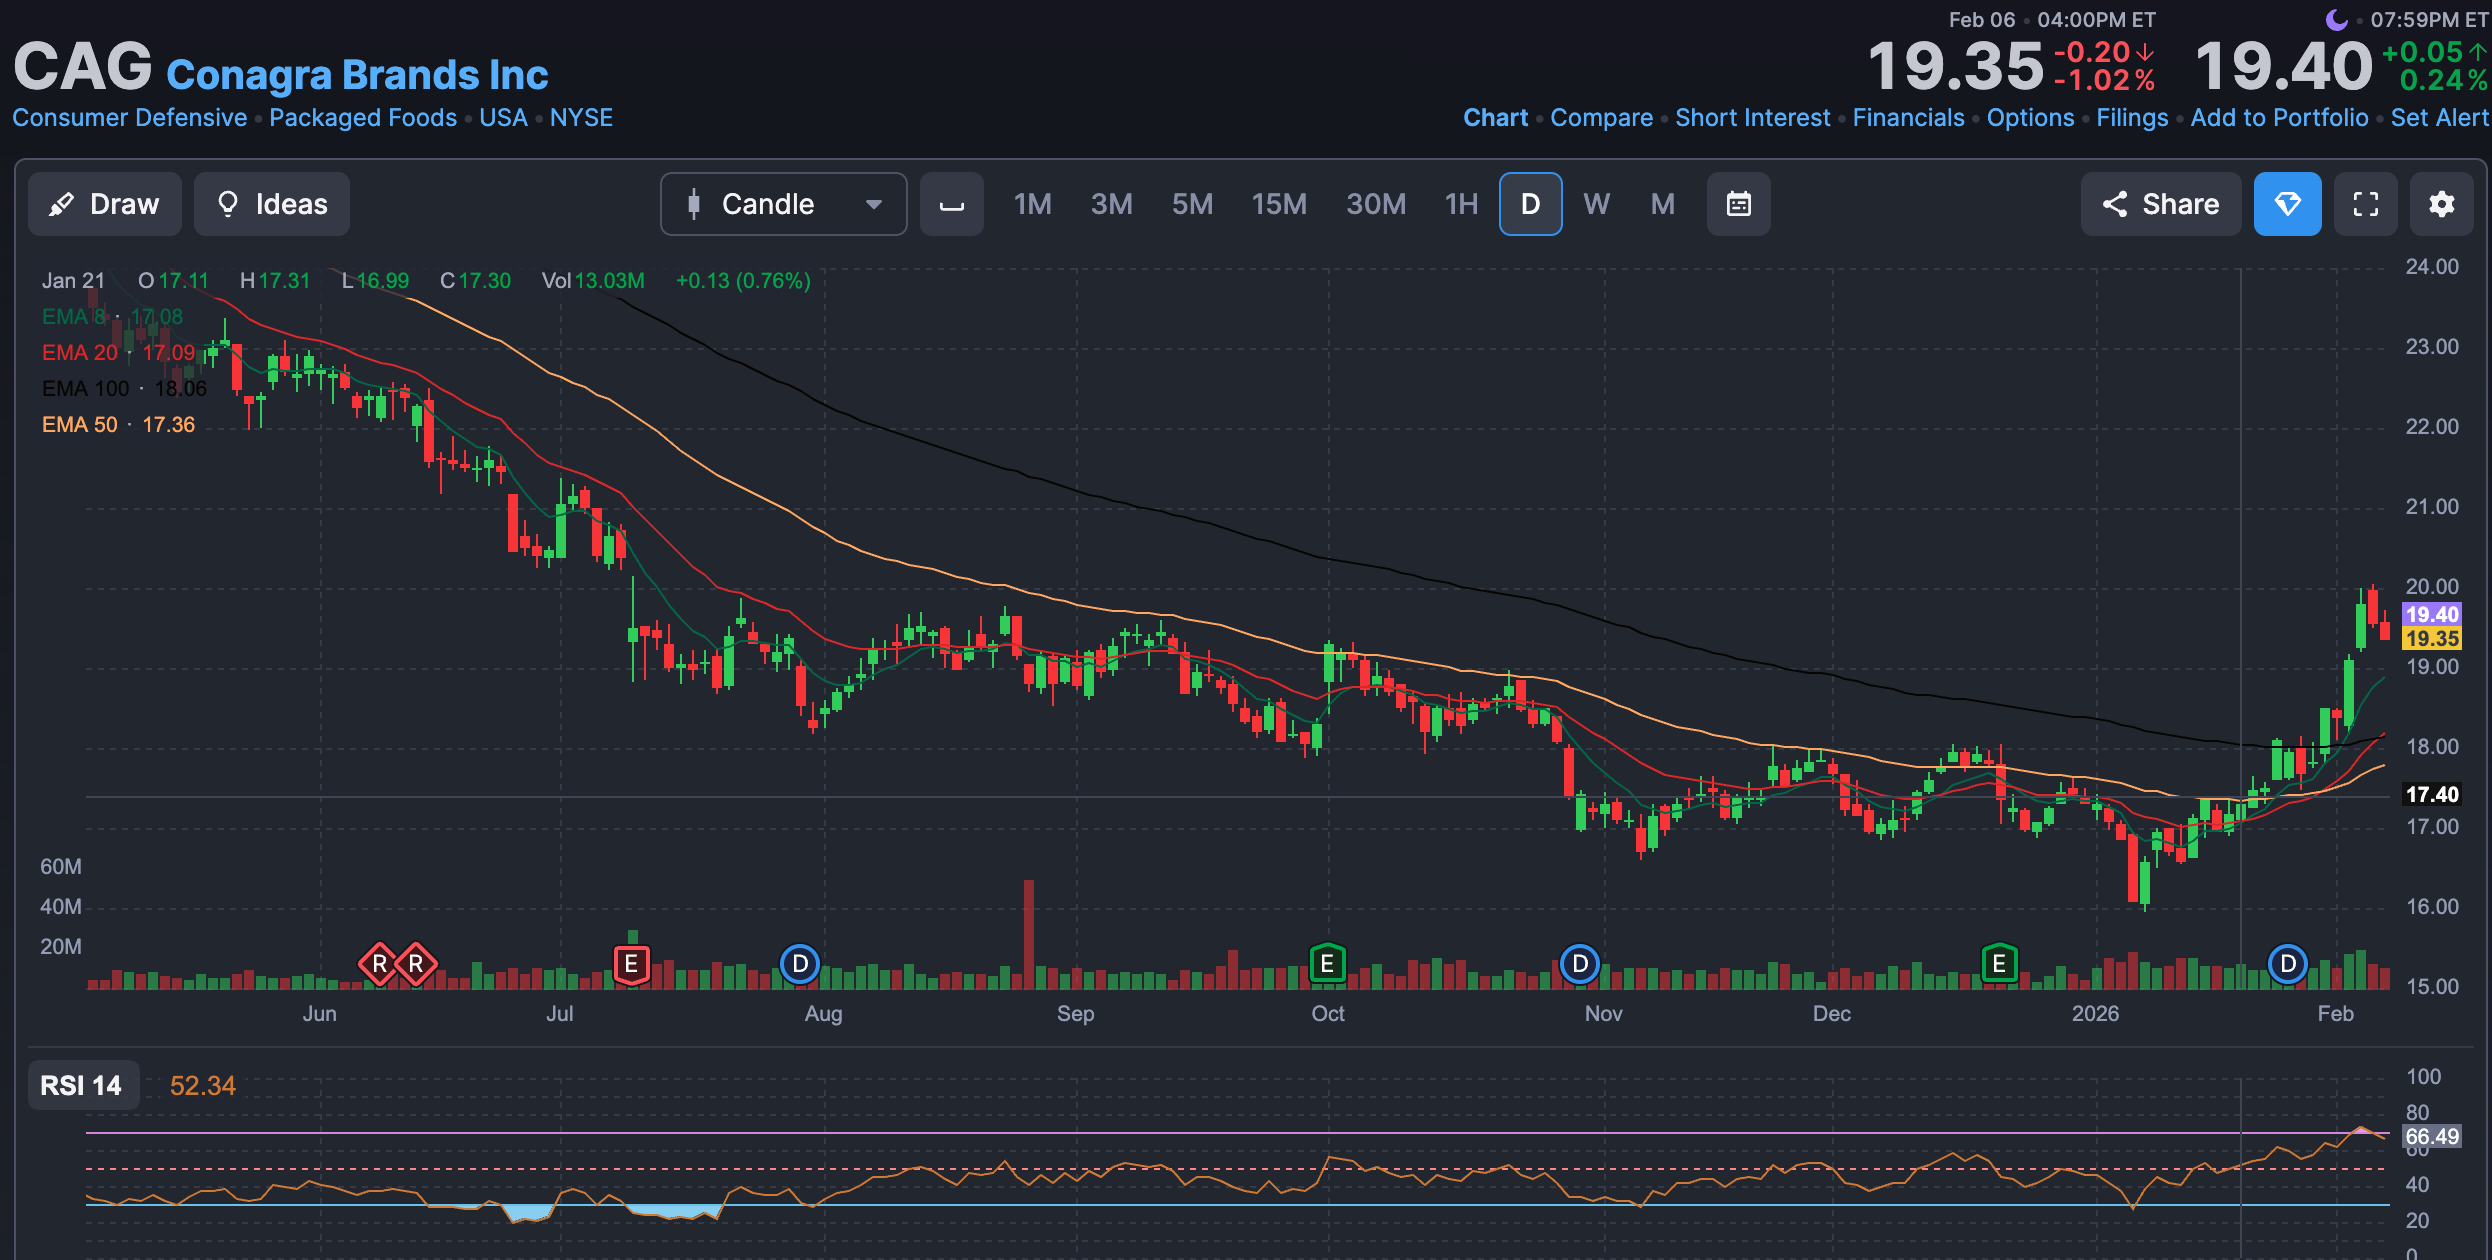
I’m still going long on the supermarkets and the eggs. But if we start to see further economic weakness, and we start talking about rate cuts again, look for all the beaten-down names like Conagra (CAG), Campbell’s (CPB), and other food names to get a bid. For six months, I told people not to buy Conagra unless it moves above its 50-day EMA and to set a 2% stop. It finally ran.
(Click on image to enlarge)
Image Source: FinViz
The trend for tech names, meanwhile, favors lower highs and lower lows, valuation compression as capital moves out of leverage and toward safety, and maybe even leveraged bond positions that could further suppress yields.
Chart 4: Good Luck, Kevin Warsh
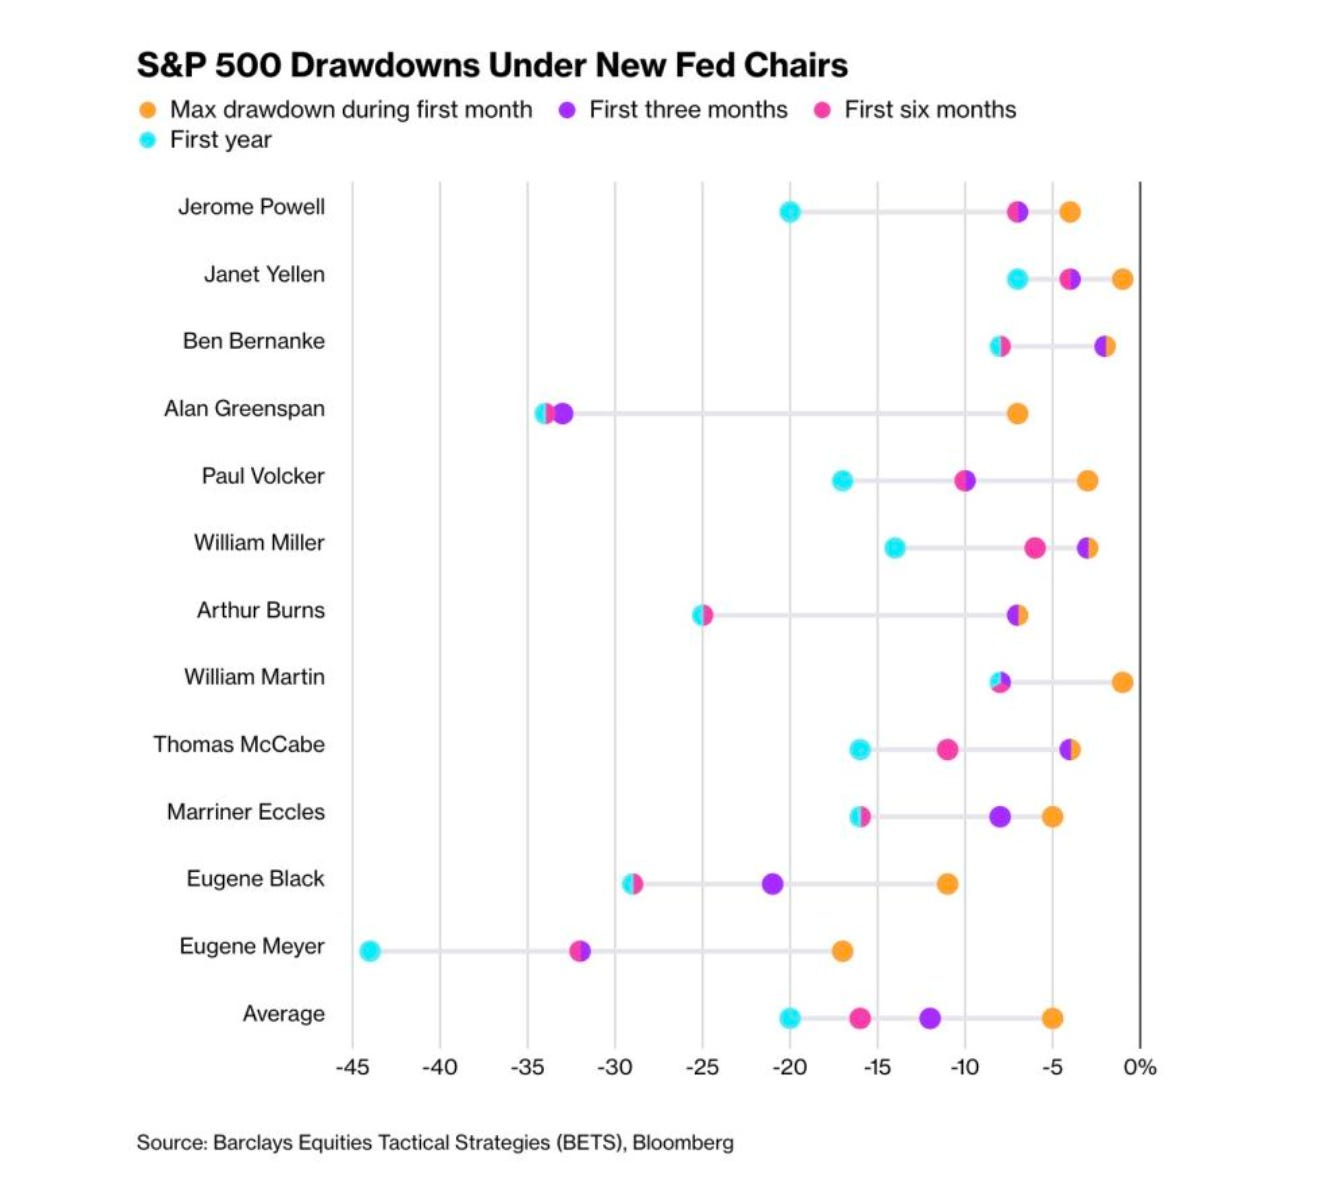
Fed Chair nominee Kevin Warsh is about to walk into a buzzsaw. Every single new Fed Chair has presided over a meaningful drawdown. The average first-year max drawdown is around -15% to -20%. Powell took almost a -20% hit in his first year. Bernanke ate -5% early but got demolished later.
The only ones who skated through the first month were Yellen and Powell, and both had the printer running hot behind them.
(Click on image to enlarge)
Image Source: Barclays
But we’re at the top of a cycle, and there’s already ample support worldwide.
Central banks are trying to prevent another run on inflation. Markets test new chairs, without exception, going back to Eugene Meyer during the Great Depression. Warsh is being framed as a hawk. The guy Trump nominated specifically because he’s tough on inflation.
Now look at the chart again -- the chairs who came in during easy-money regimes (Yellen, Bernanke early) had shallow drawdowns. The chairs who came in during tightening or transition periods (Volcker, Burns, Powell) got hammered.
Warsh is inheriting: Japan blowing up, a 50% Bitcoin crash, $36 trillion in debt, the dollar in free-fall, and a basis trade unwind draining ETF flows.
It’s already aging me. He’s walking into the Arthur Burns zone, not the Janet Yellen zone. Good luck.
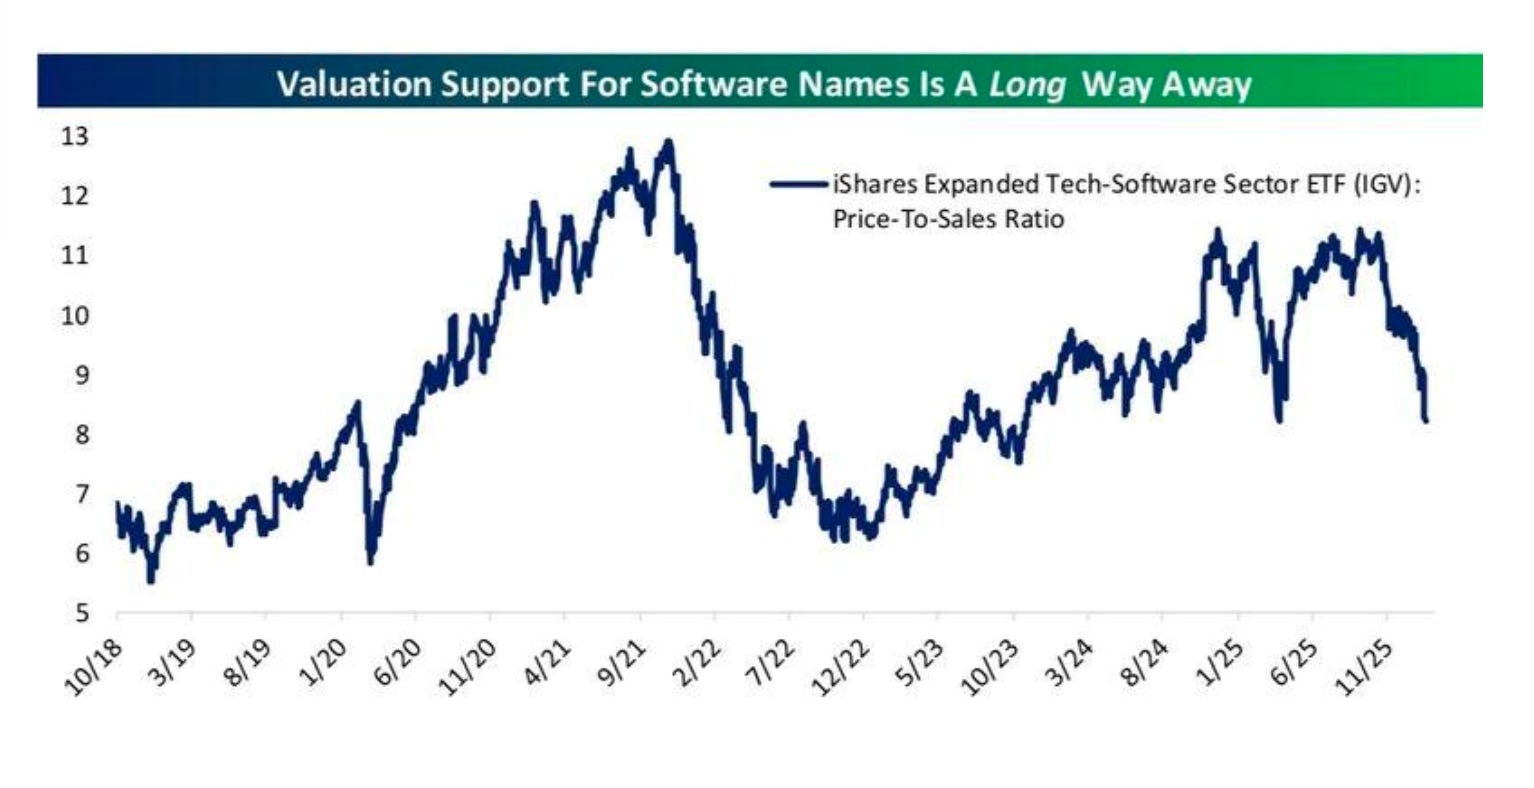
Chart 5: Sorry, Goldman, But The Software Rout Isn’t Over
Software stocks got a bid on Friday after Goldman Sachs called a “bottom.” That got a lot of people to back off and short covered positions -- and we had a squeeze on the IGV.
But let’s be honest. Valuation compression should continue, as we’re in an incredibly similar situation to 2021 -- coming off the top of a liquidity cycle. Compression is likely to continue.
(Click on image to enlarge)
Image Source: Bespoke
You’ll hear a lot of chatter about valuations being stretched. That’s the legendary Scott McNealy quote. Back in the day, he was CEO of Sun Microsystems. At its peak, Sun’s stock had traded at 10x revenue. Here’s the quote:
“At 10 times revenues, to give you a 10-year payback, I have to pay you 100% of revenues for 10 straight years in dividends. That assumes I can get that by my shareholders. That assumes I have zero cost of goods sold, which is very hard for a computer company. That assumes zero expenses, which is really hard with 39,000 employees. That assumes I pay no taxes, which is very hard. And that assumes you pay no taxes on your dividends, which is kind of illegal. And that assumes with zero R&D for the next 10 years, I can maintain the current revenue run rate. Now, having done that, would any of you like to buy my stock at $64? Do you realize how ridiculous those basic assumptions are?”
The point is brutal and simple: when you pay 8x or 10x sales (not earnings, but sales), you’re assuming the company can hand you every single dollar of revenue it generates for a decade.
That means no costs, no taxes, no employees, and no R&D -- and you’d still barely break even. The business could be incredible, and the stock could still destroy you because you overpaid. You’ve been warned.
Chart 6: The Original Buy-the-Dip
In my weekend reading, I found myself revisiting the Rothschilds while writing my latest piece for Postcards from the Edge of the World.
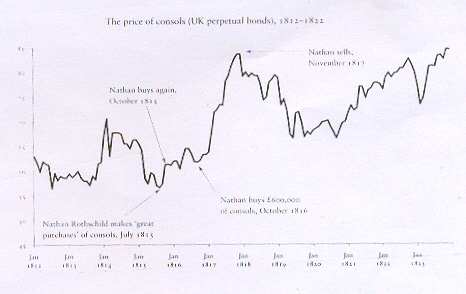
Nathan Rothschild got stuck with a mountain of gold nobody needed after Waterloo ended too fast. His escape? Buy British bonds at 60, hold for two years while his brothers begged him to sell, and exit above 80. A big gain; it feels like one of the great, original “buy the dip” moments.
But here’s what matters for us. Britain funded that entire war by suspending gold convertibility, printing paper credit at home, and rolling debt forward forever. By 1815, the national debt hit 250% of GDP. They never paid it back. They just kept servicing it. That wasn’t a wartime trick. It became the operating system.
They had permanent debt. Private bankers became an essential part of the state's infrastructure. Financial repression became a regular policy. That’s the system Jerome Powell is still running, just with better spreadsheets. Maurice O’Shannassy wrote a fantastic deep dive on how this whole machine was built — go read it.
Chart No. 7: So Goes Microsoft
This is Microsoft’s outperformance against the S&P 500 since 2020. You can see that it’s regained all its lead on the Index since the launch of ChatGPT.
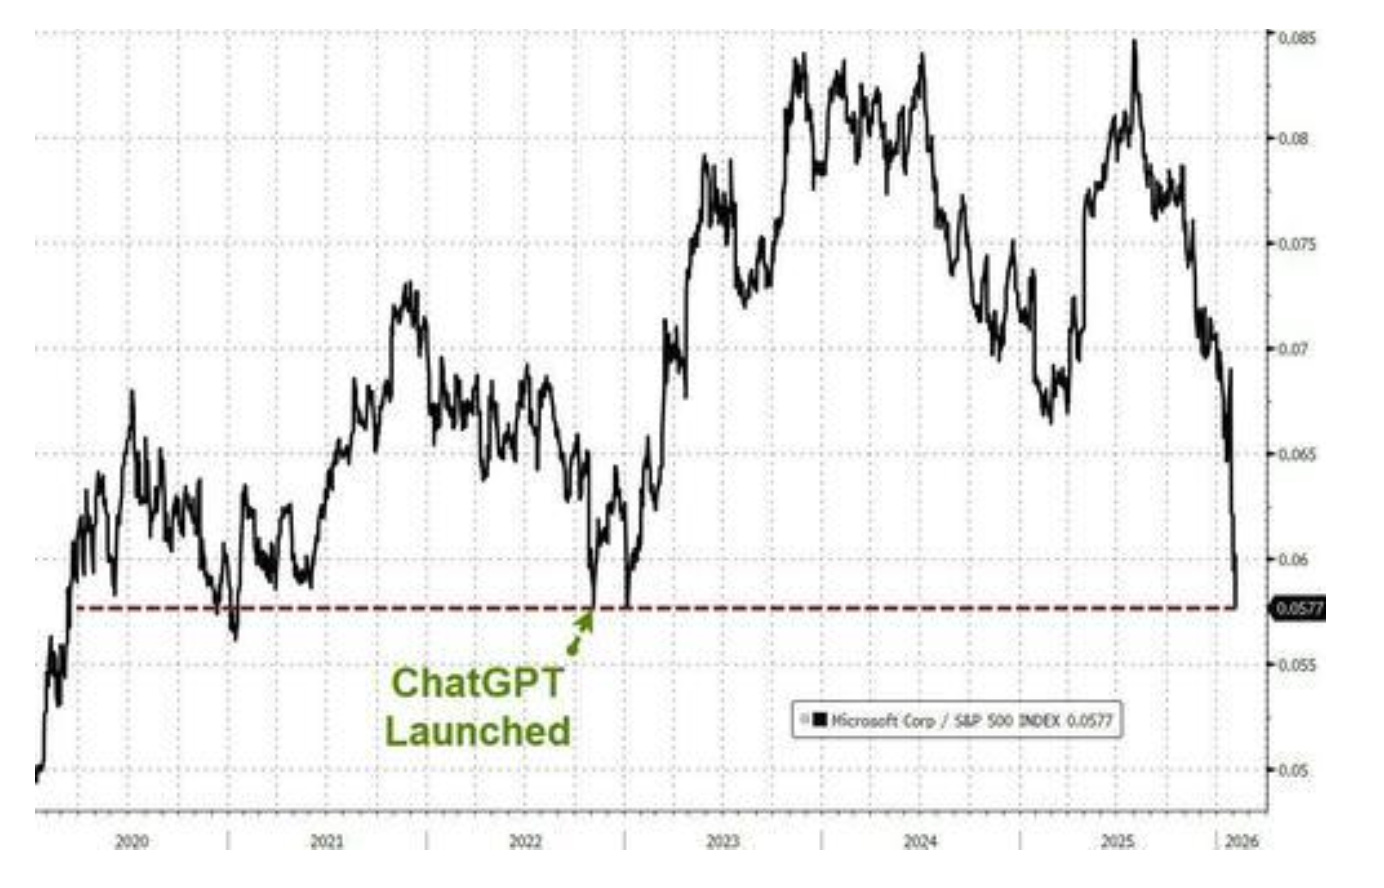
It’s been wild to see everyone in the world become an expert on software companies over the last few days, as they continue to talk about valuations and the impact of AI. Substack right now is rife with people saying that software names are cheap, etc.
I’m telling you right now, AI is exponential. The real job’s impact isn’t here yet. But it’s coming. We’re already at a point where three guys with strong prompting skills can produce more content in a week than an entire 300-person media company. And if Microsoft is taking it on the chin, what do you think is coming?
Claude’s legal platform (which I used last night) is exceptional in its early development. This thing goes into Metadata and can tell if contracts being offered are fresh or based on old templates that immediately create conflicts. Its scheduling and workflow elements are better than most enterprise software.
Here’s the thing: they’re going to get tons of people to dump their Monday and Asana accounts and then jack up the price. Think Amazon on APIs. Anthropic will be the new toll road. Bookmark this and revisit in 12 months -- after the IPOs happen.
What’s On Tap This Week?
Let’s look at what’s front and center for the coming trading period.
Monday
Earnings from Apollo Global Management: Save the Private Equity companies from themselves. This is a big one. Apollo matters because it’s a window into private credit and alternative asset flows.
Tuesday
The earnings calendar is massive: Coca-Cola and McDonald’s are the consumer bellwethers. If McDonald’s reports that traffic is declining (not just ticket sizes falling), that’s a warning sign about spending at every income level. Coca-Cola will do a lot of heavy lifting in the consumer defensive sector, as it has already been crushing it since the October top for the high beta noise.
Wednesday
This day will set the tone for the rest of February: The delayed January jobs report arrives in the morning, five days late because of the government shutdown. The Street expects around 70,000 new nonfarm payroll positions and steady unemployment at 4.4%. Every signal pointing toward the labor market has been deteriorating.
If the number disappoints, the entire market will pivot to one question: Does the Fed have room to cut rates, or is the economy deteriorating without a policy response? We’re still weeks away from that March Fed meeting.
Thursday
Applied Materials is the semiconductor equipment bellwether of the week: If chipmakers are still spending aggressively on manufacturing capacity, the AI infrastructure buildout is real. This unwind doesn’t feel over -- but that’s just me.
Coinbase will tell you everything about where cryptocurrency capital is flowing after Bitcoin’s 12% two-day plunge and subsequent recovery to $70,000 last week. The broader question around digital assets remains unresolved. Bitcoin has been acting more like a leveraged technology fund with no fundamentals than a hedge against anything. As I said this week, maybe that’s the point.
Friday
CPI: The big one. The monster. Expectations call for a 0.3% monthly increase in consumer prices and 2.5% year-over-year. Even that expected number is still above the Fed’s 2% target, which tells you the final stretch of this inflation fight is far from over. If the number comes in hot, rate cut expectations will collapse and risk assets will take another leg down.
All right, let's call that a wrap.
More By This Author:
What If Bitcoin's "Utility" Is to Blow Up?What "Risk" Means During Earnings Season
Optimism Builds On Trade Deal And Palantir Beat

Comments
Log in or sign up to join the conversation.