


Summary
- If the US Treasury issues new debt in $trillions in 2021, bond yields will fall and equities sink. The primary linkage to this situation, is the extent of yield decline.
- Falling yields this manner symptomatic of capital account flows into the US, and that pushes US Dollar higher. There has been a negative correlation between yields and DXY since QE1.
- Yields and debt issuance used to positively correlate. That flipped on Sept 2003. That meme does not apply anymore; as the issuer of debt, and buyer are the same government.
- G5 M2/M1 Money Supply which are soaring now, will take a swan dive as from early 2022. Looks a W - shaped global recovery in the pipeline. Actually it is now structural -- already baked in the cake.I think I may know what will kill global growth in 2022 -- the rise of the US Dollar in 2021.
- That yield will stay low even with large issuance is common sense -- that government will try the put the cost of the debt it incurred as low as possible (and for as long as possible), as it controls the levers of short term interests as well. And what that govt does not control (the long end), it threatens to cap with yield control whenever it looks like yields are going to rise.
------------------------------------------------------------------------------------
----------------------------------------------------------------------------------------
-----------------------------------------------------------------------
During the twelve months of 2020, PAM delivered phenomenal real-dollar trading performance, the best at Seeking Alpha:
PAM's flagship Swing Portfolio, year-to-date (December 31, 2020) delivered $100, 181,522.77 net profit on $11,172,813 operating capital.
Year-to-date performance: 754.20%, on 888-98 win-loss trades.
December 2020 spreadsheet here:
Year to date 2020 spreadsheet here.
--------------------------------------------------------------------
WEEK-END MUSINGS
JANUARY 9, 2020
robert.p.balanModeratorLeaderOwnerJan 9, 2021 12:26 PM
What happens if the US Treasury will issue trillions in new debt in 2021?
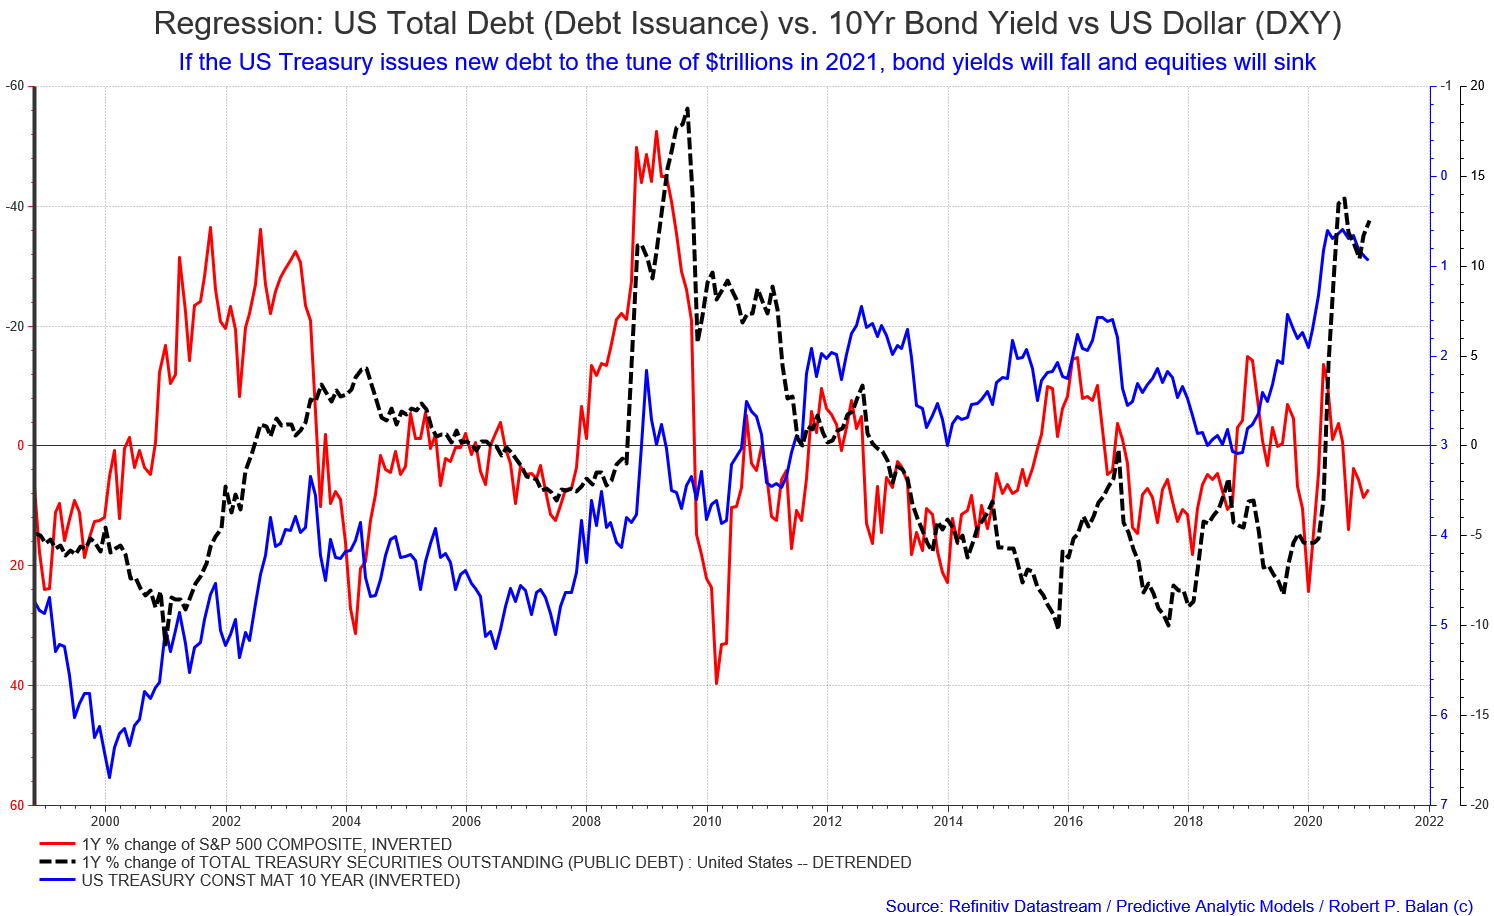 If the US Treasury issues new debt to the tune of $trillions in 2021, bond yields will fall and equities will sink
The primary linkage to this situation, is the behavior of Yields, as usual -- that is, to what extent yields will decline.
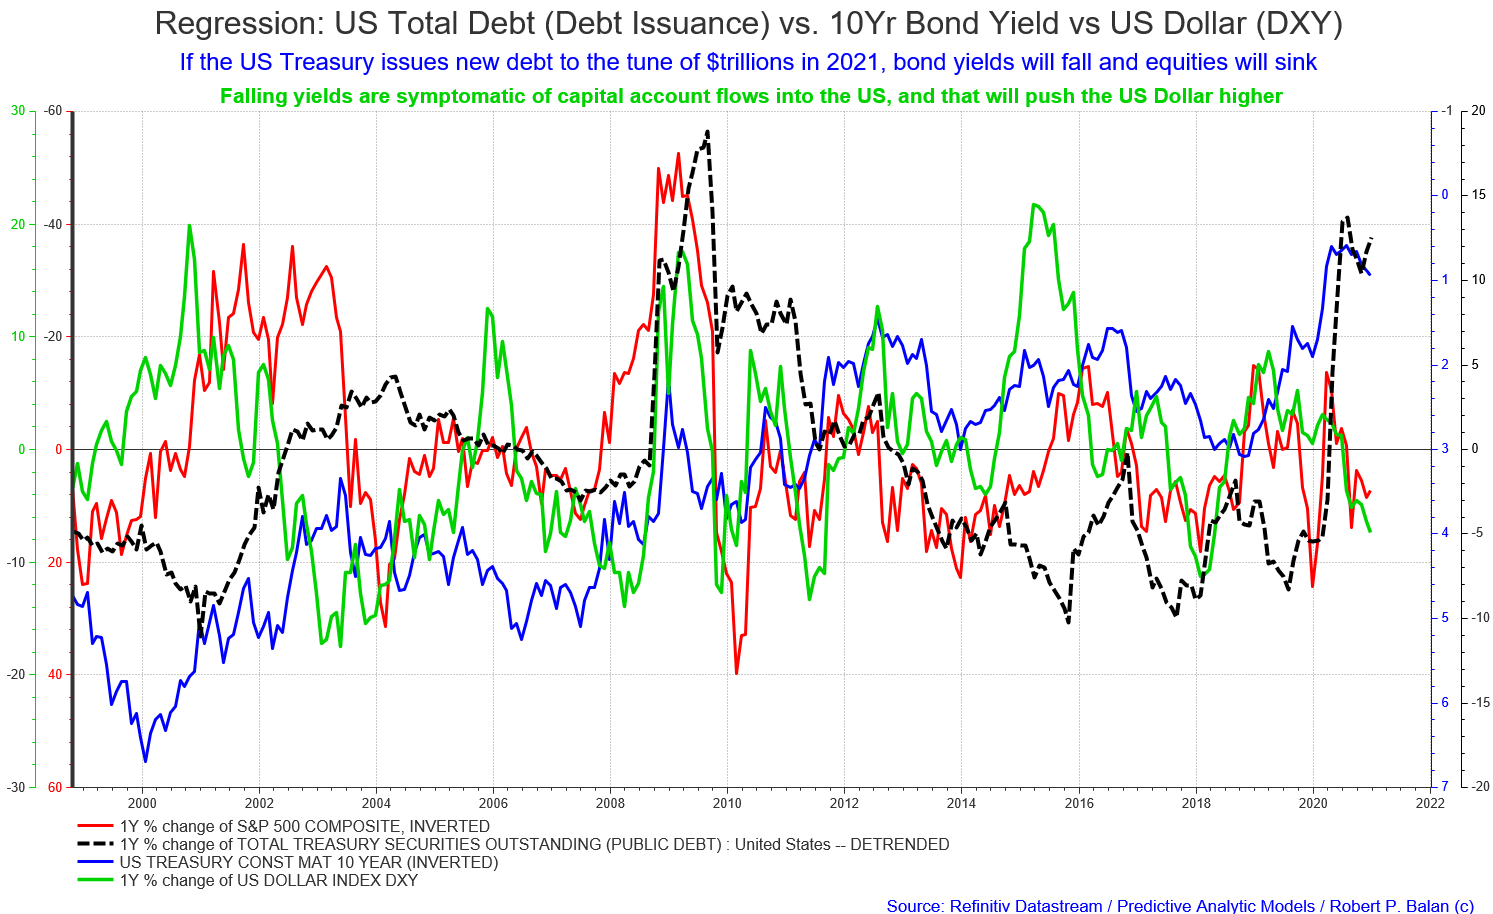
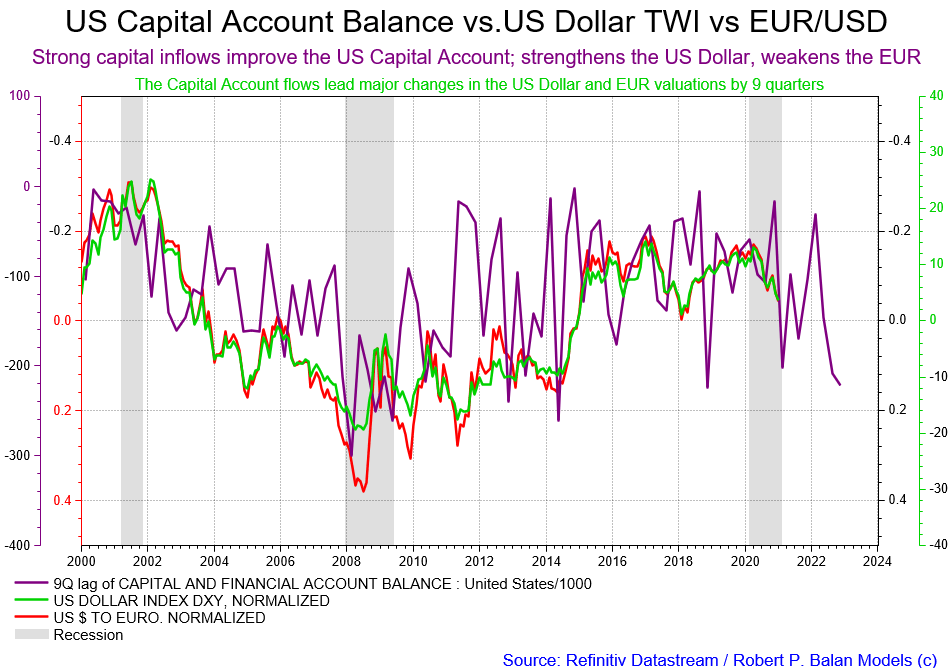
Falling yields are symptomatic of capital account flows into the US, and that will push the US Dollar higher, as shown in the chart below.
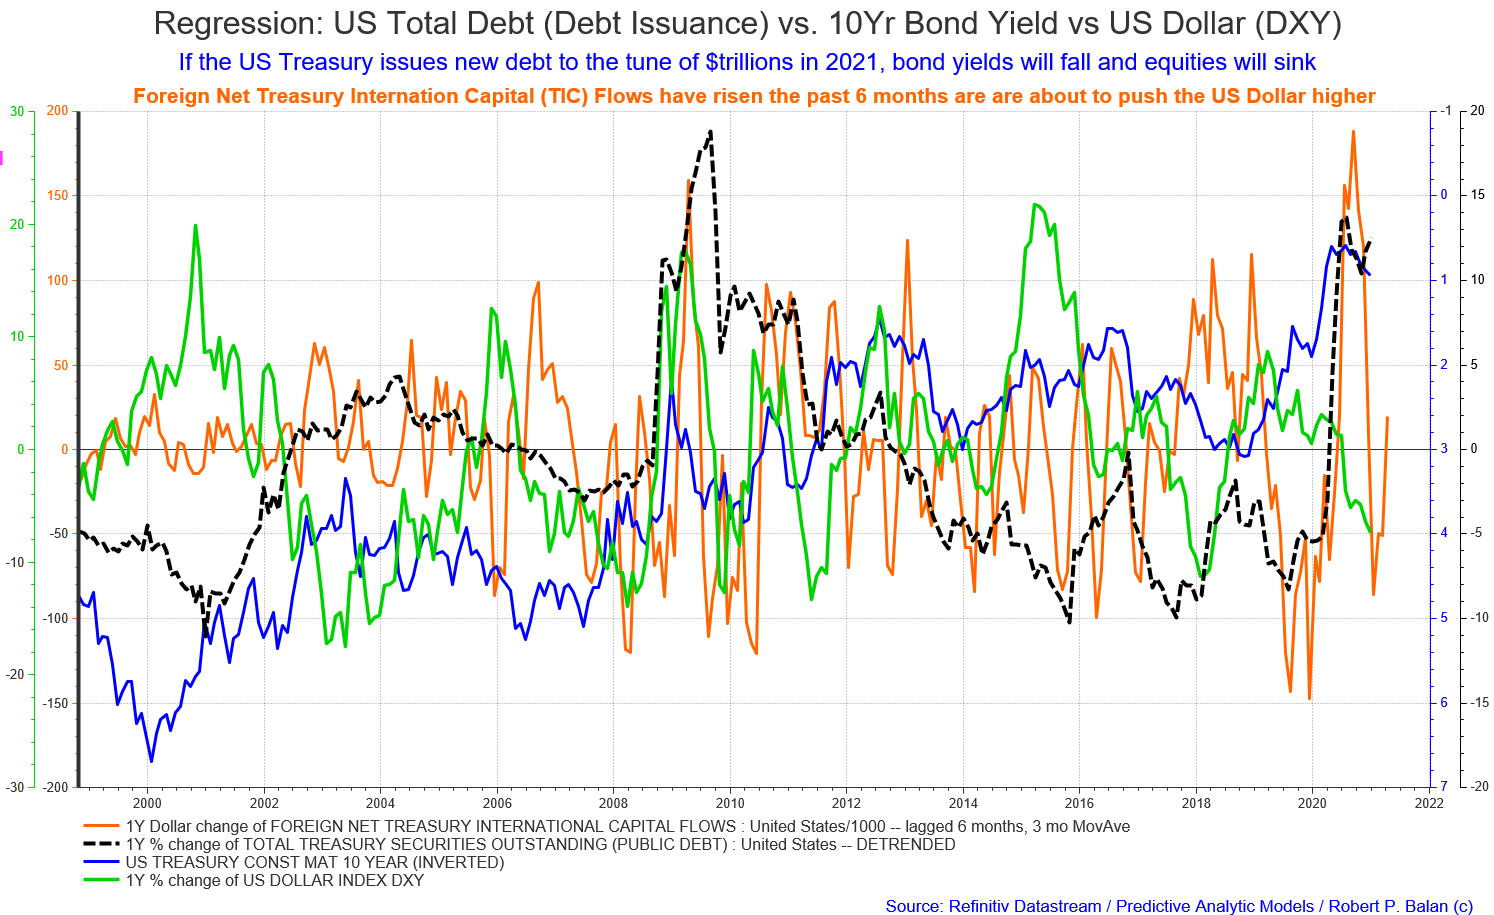 Foreign Net Treasury International Capital (TIC) Flows have risen the past 6 months are are about to push the US Dollar higher.
It's too nice outside to remain indoors. Will continue tonight.
timothy.r.kiserJan 9, 2021 2:58 PM
Walk 5 miles today. Sun ☀ is out here also. Happy weekend.
sparketJan 9, 2021 5:35 PM
39 Fahrenheit in Dallas, TX but blue skies. Lovely day to be outside.
robert.p.balanModeratorLeaderOwnerJan 9, 2021 6:43 PM
A PAM member DMed said common sense dictates that more supply, the higher rates should go. This is the story on that.
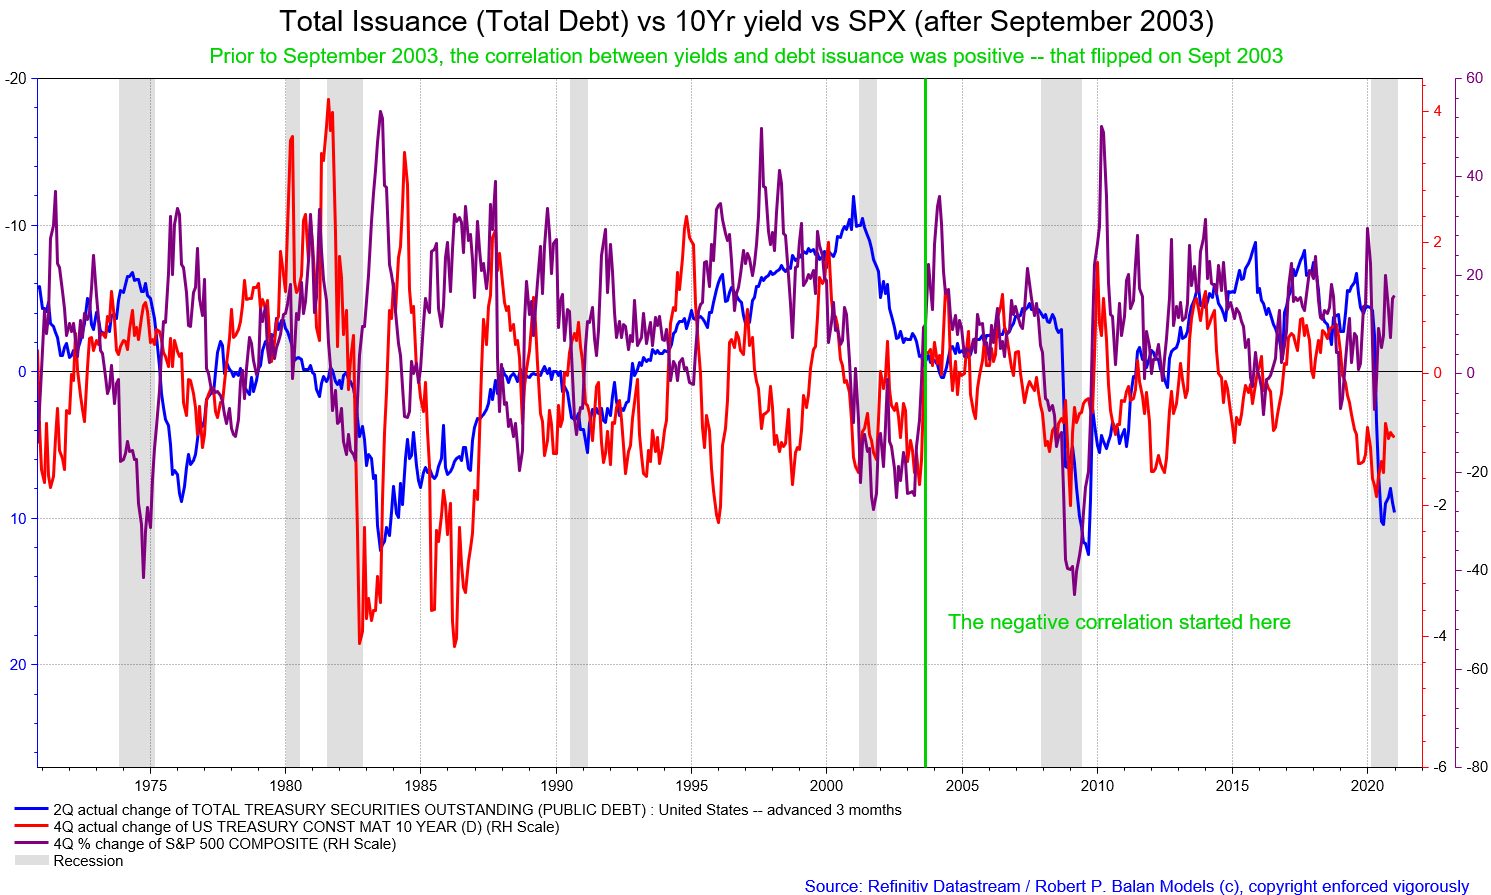 Prior to September 2003, the correlation between yields and debt issuance was positive -- that flipped on Sept 2003.This focus on the supply does not have that cachet anymore -- not when the issuer of debt, and the buyer of that debt, is the same government.
Common sense -- that government will try the put the cost of the debt it incurred as low as possible (and for as long as possible), as it controls the levers of short term interests as well. And what that govt does not control (the long end), it threatens to cap with yield control whenever it looks like yields are going to rise. No-brainer for a very wily government. That is why once the govt discovered that control mechanism, it is not afraid of creating money ab nihilo, industrial-scale, because the cost of debt is basically zero.
jayn1321Jan 10, 2021 2:12 AM
Can yield control on the long end fail? If so, how would this take place? Inflation via commodity prices finally via infrastructure spend or helicopter money? I.e. dwindling asset inflation? I may be way off here...
robert.p.balanModeratorLeaderOwnerJan 9, 2021 7:09 PM
That is why all those false prophets of doom who say that this large scale debt issuance will doom the Western civilization as we know it, do not seem to have any bloody clue.
What is certain, the counter-factual, is if the government allows nature to take its course, (as the Austrian "economists" want it) Western civilization is indeed finished. China (who is not afraid of ab nihilo issuance), wins without lifting a finger. The Chinese are very very smart -- just create tons of CNY without much ado, fanfare or drama.
Whenever I come across an article at Seeking Alpha which claims that there is no link between debt and growth, or if there was, the conversion of debt to GDP is minuscule. And oh, by the way, rising debt will push interest rates to the moon. The problem with these narratives, is that, well, they are just narratives. No data to present, or they will snip up some charts from a publication (usually old). So I came up with this spoiler.
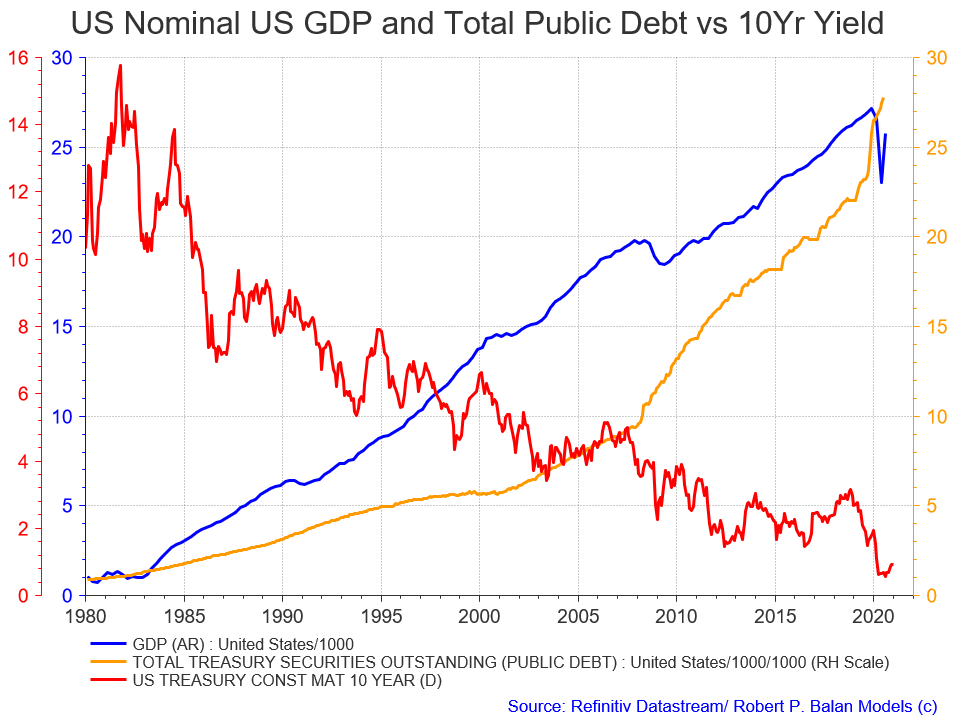
You get the GDP that you paid (or incurred debt) for. And oh, by the way, debt has rising been since Noah's time, and yields have consistently been plunging during all that time.
I tell you, I am the most hated Service Provider at Seeking Alpha.
flytightJan 9, 2021 8:31 PM
robert.p.balan Well then I can tell you "I love you Mate" At least you tell the truth, and from that truth we can prosper and sleep well at night. Well timed as always RB. Thank you!
robert.p.balanModeratorLeaderOwnerJan 9, 2021 8:45 PM
@flytight -- Thanks a lot mate! I love you too!
On an insight, I just did this chart:
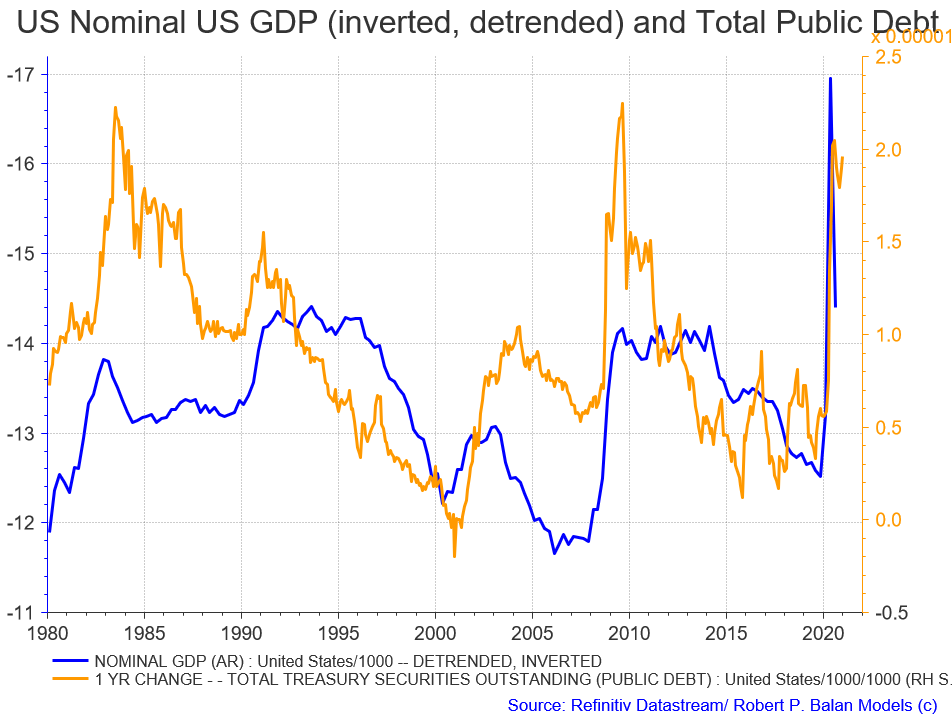 This confirms that Debt Issuance is contracyclical to GDP growth -- the covariance is inverse.If we have a little of growth this year, maybe issuance will slow a little.
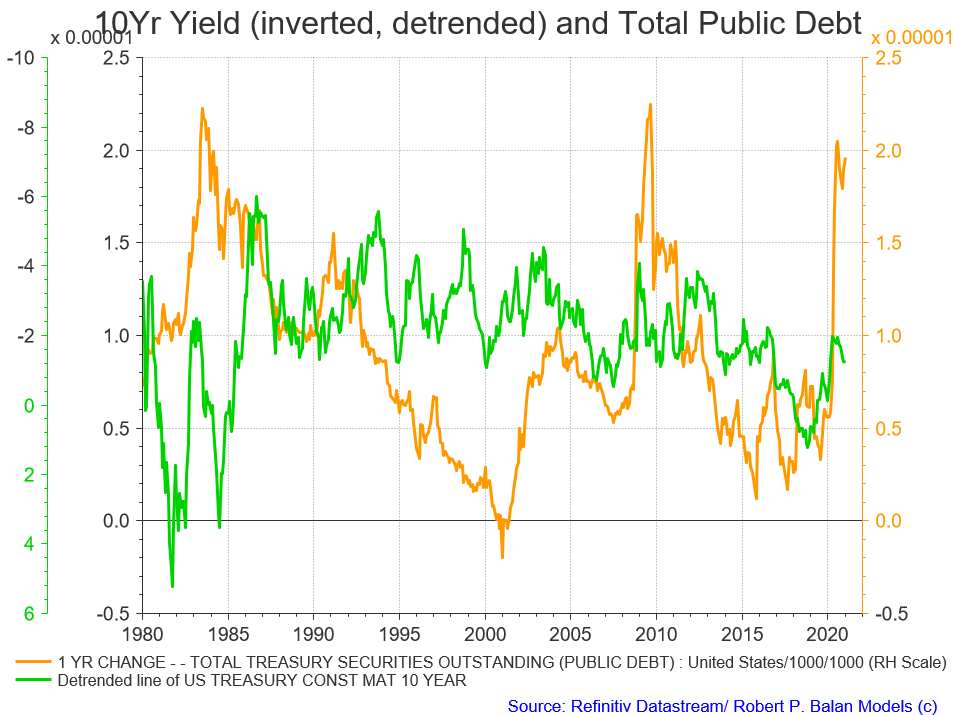 Yields and Issuance are still negatively correlated.
Why?
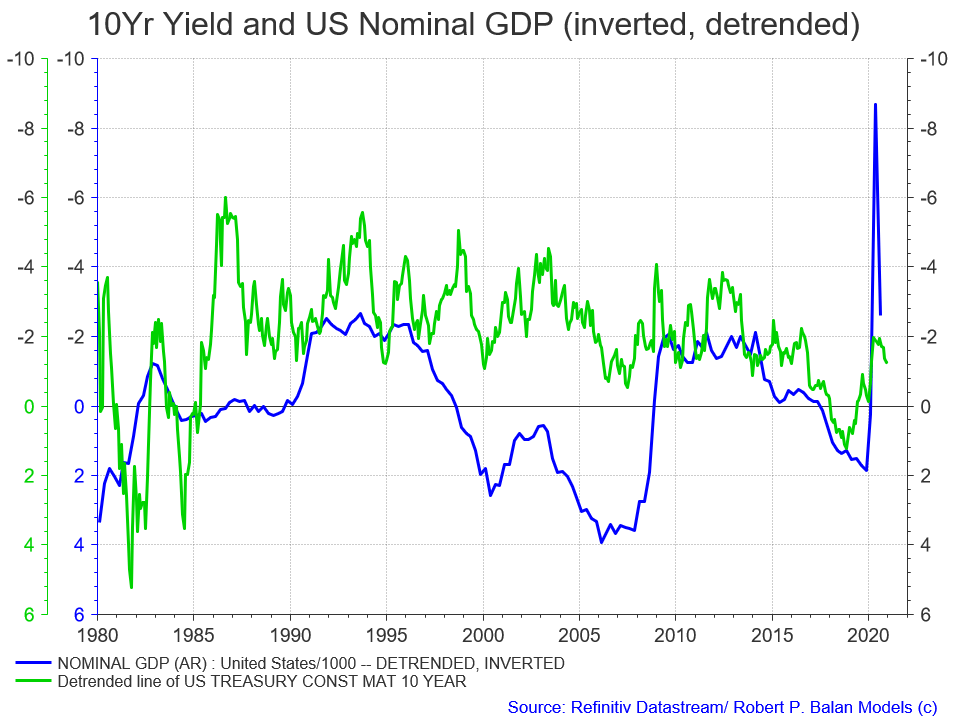 Because Yields and US Nominal GDP are positively correlated. Sort of, the friend of my friend, is my friend, and vice versa.These are ad hoc charts, created on-the-fly -- I will make a proper presentation and improve the charts. Sorry.
 I have been wanting to revisit this chart. It has a bearing on the trends of the USD and the EUR by as long as 9 quarters.If this is the case, then US GDP growth for the entire 2021 will be better, relative to Global GDP growth.
I use the EUR as a real time proxy for Global GDP.Actually it is synthetic DM is what I use (very close resemblance to EUR, of course).
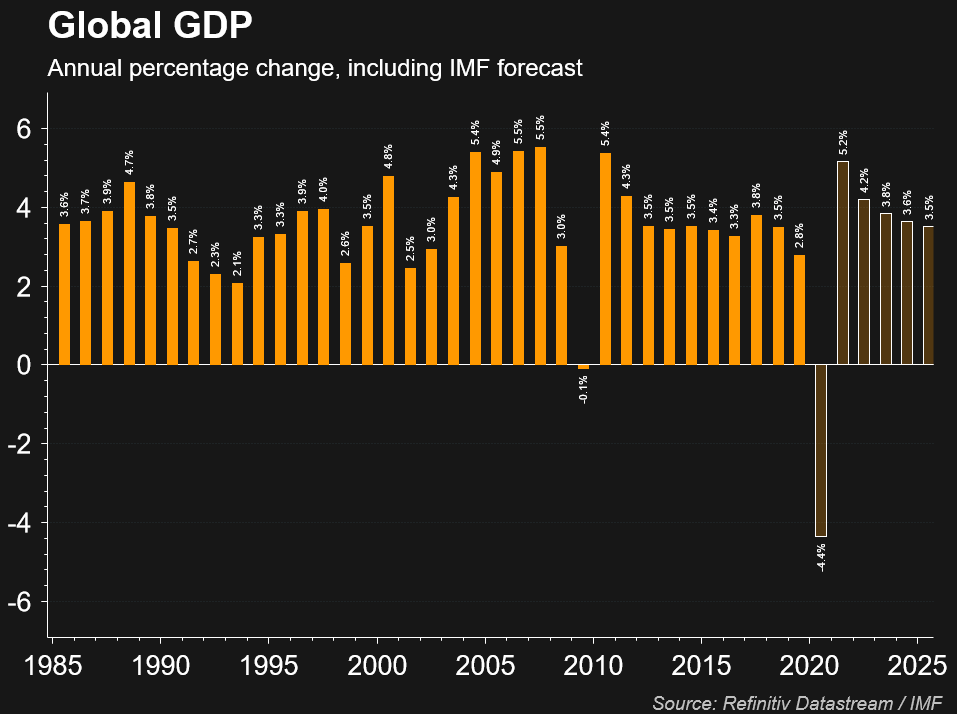
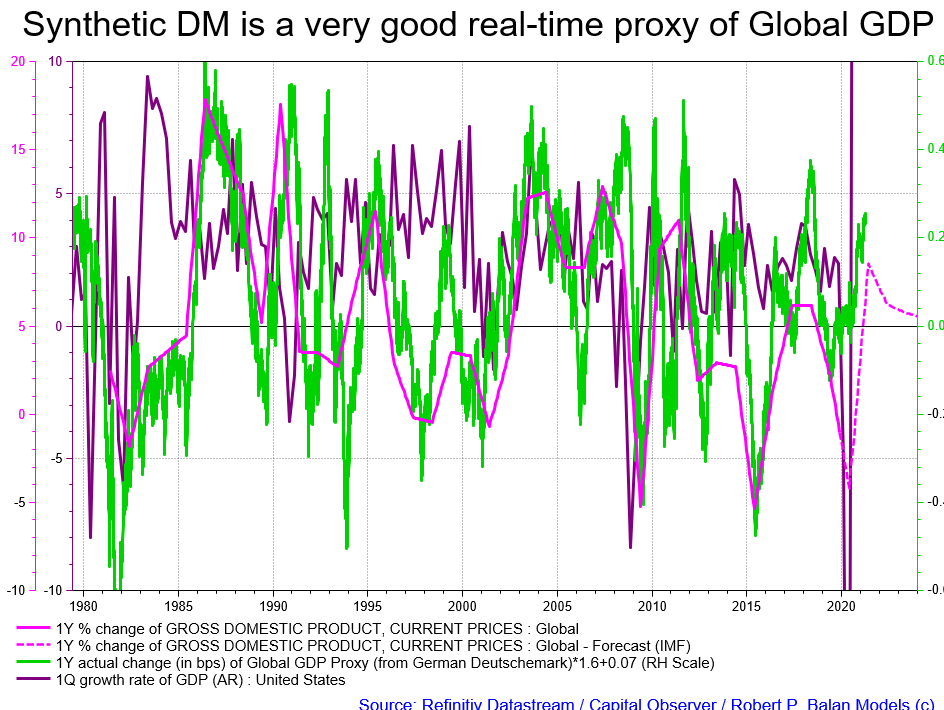 It the IMF's forecast of a Global GDP keeling over in Q1 2021 is correct, then EUR will keel over too, and USD (DXY) will soar.
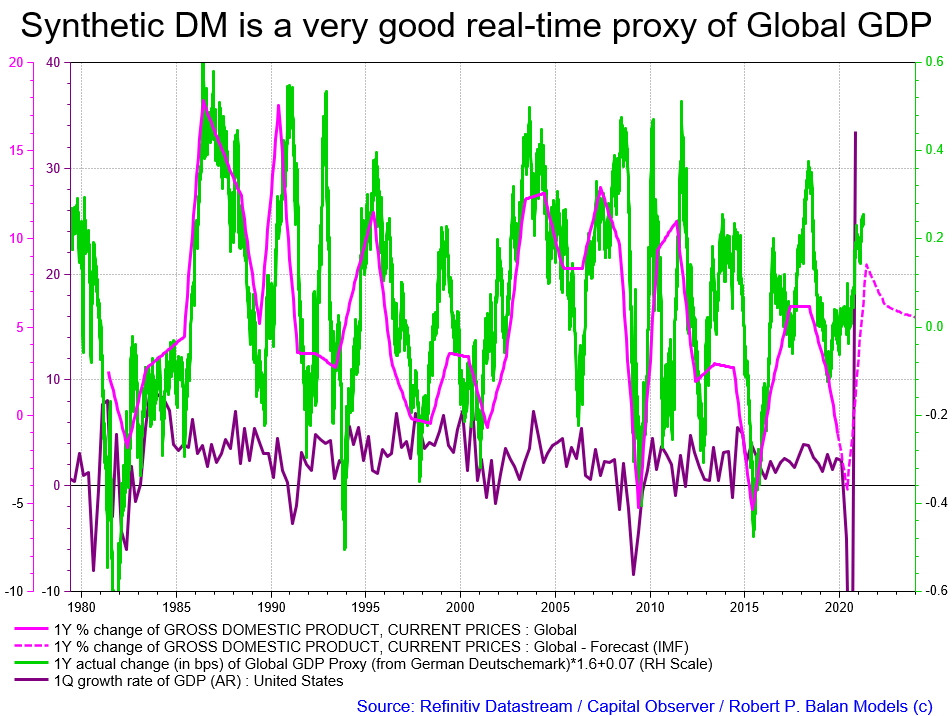 If Global GDP is going nowhere per the IMF, its hard to see the US GDP going gangbusters. US GDP qoq above, and yoy below
 My apologies -- the X axis is not in Quarters, it is in years. So it is 2022 that is in trouble.
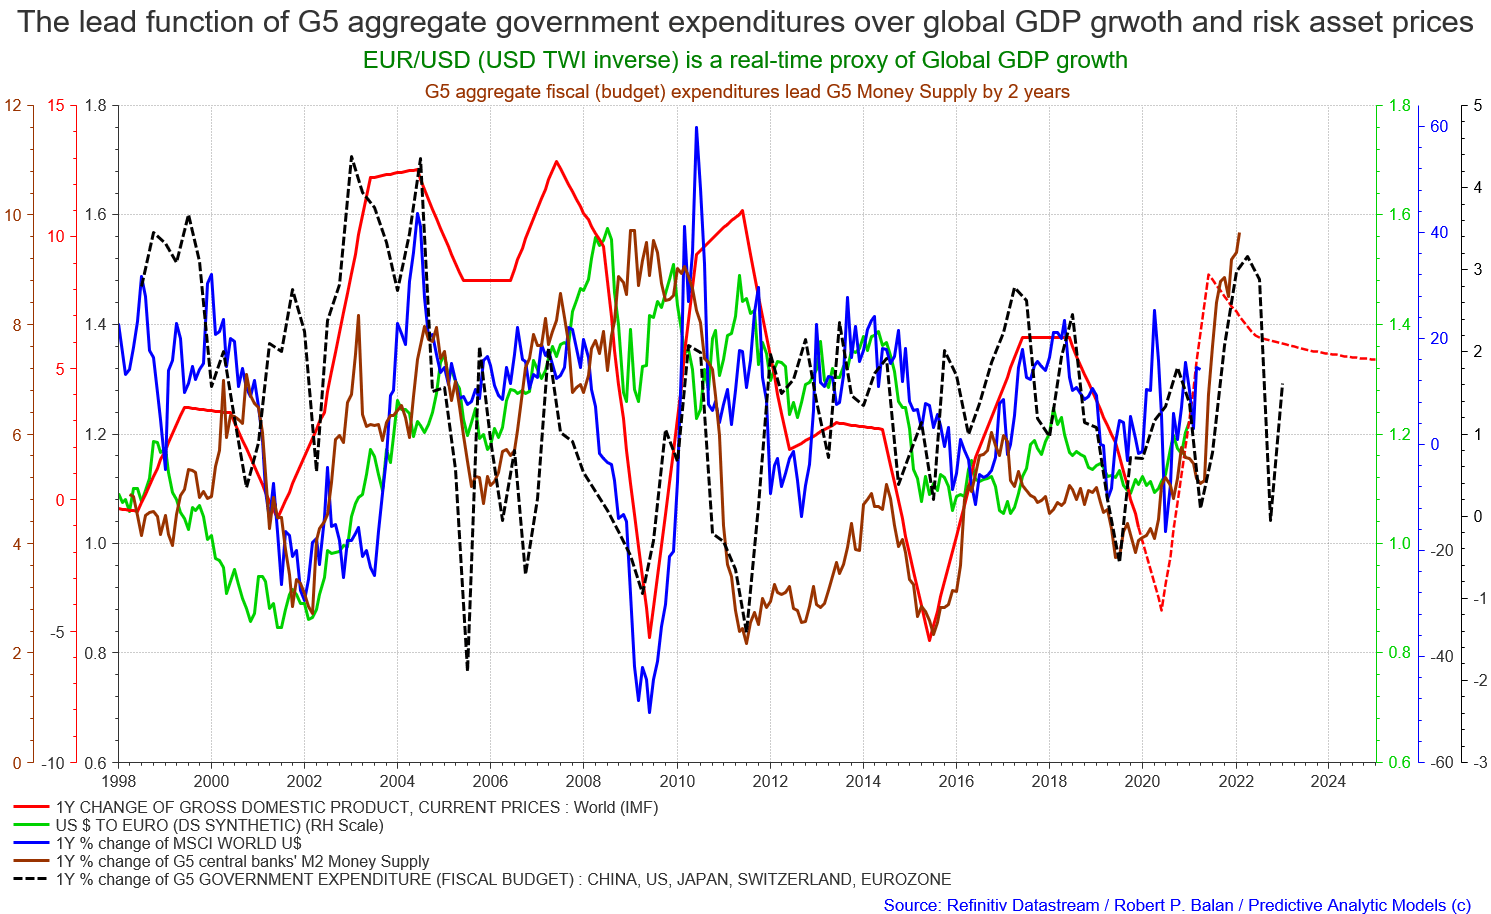 That is clear from the global, aggregated planned government expenditures in the G5 countries. G5 M2/M1 Money Supply which are soaring now, will take a swan dive as from early 2022. Oh my! Looks a W - shaped global recovery in the pipeline. Actually it is now structural -- already baked in the cake.
I think I may know what will kill global growth in 2022 -- the rise of the US Dollar in 2021.
And this is why:
The Global Terms of Trade (Exports/Imports) is negatively correlated to the USD
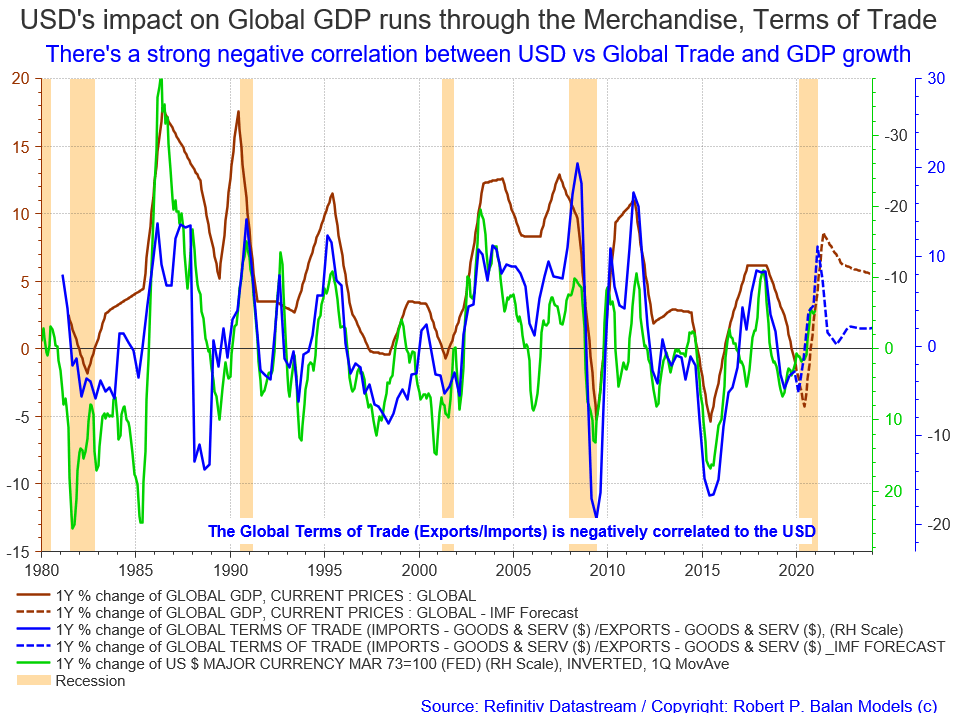
If the US Dollar firms up in 2021, and for me that is almost a given, then global GDP in 2022 will be lower, probably even lower than the IMF forecasts.
 All these spell trouble for crude oil prices.
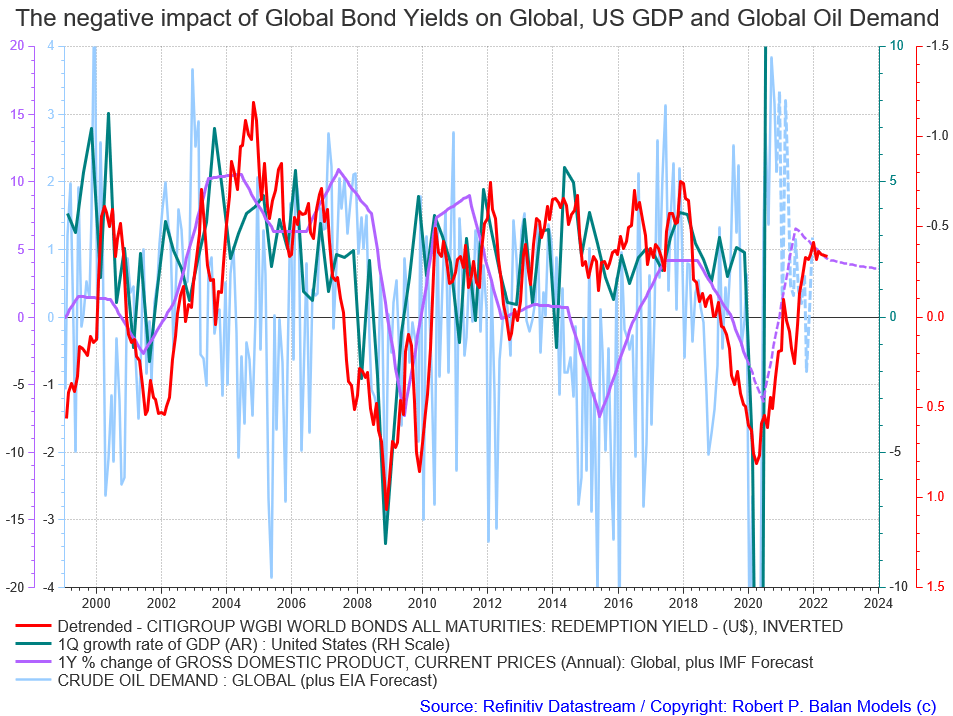 EIA global oil demand for the entirety of 2021 looks dismal -- 2022 will likely look worse.Commodities are supposed to take off this year on a new cyclical recovery.
 But it has been a case of a one-trick pony -- commodity growth this year, has been, so far, based just on the sharp recovery in China. No broad based demand, coming from elsewhere. I was telling the Bossman yesterday that the cyclical upturn in the commodities versus equities story will probably take place in 2023, not this year.
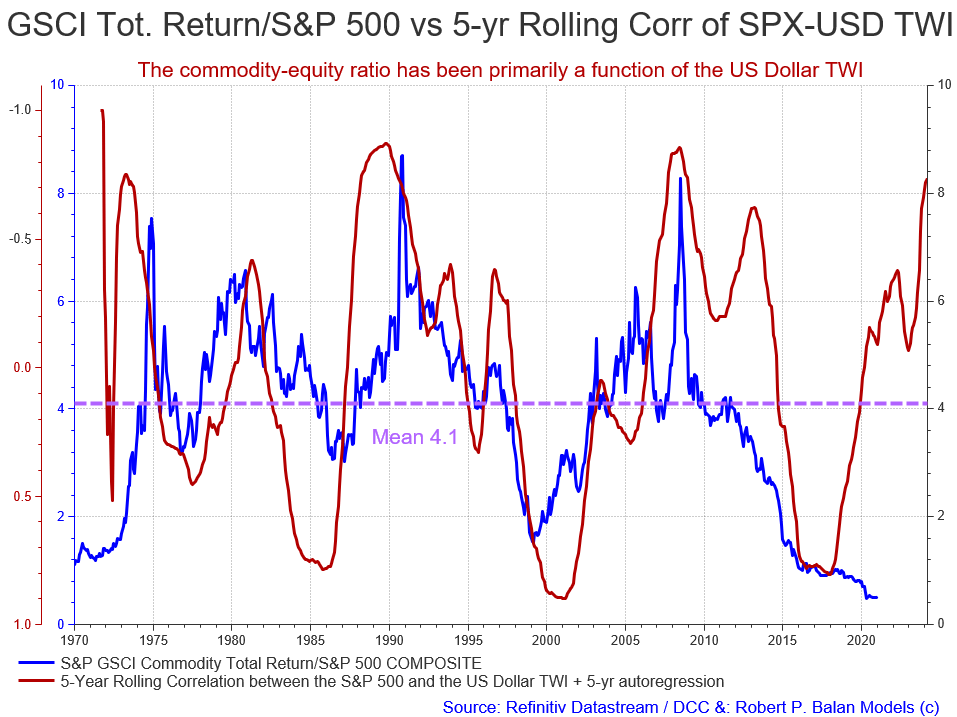
I created this chart circa 10 years ago, and now I see it replicated everywhere, even at ZeroHedge.
This is the reason why I don't think this cycle will take off this year. This commodity/equities ratio is strongly influenced by the direction of the US Dollar. If the USD will recover this year, as we believe it would, there is no way commodity will outperform equities. The cycle will not reassert this year.
Ok. Time to go. Will conclude and finish a presentation tomorrow. GN everyone-
JANUARY 10
robert.p.balanModeratorLeaderOwnerJan 10, 2021 8:10 AM
Common sense -- that government will try the put the cost of the debt it incurred as low as possible (and for as long as possible), as it controls the levers of short term interests as well. And what that govt does not control (the long end), it threatens to cap with yield control whenever it looks like yields are going to rise. No-brainer for a very wily government. That is why once the govt discovered that control mechanism, it is not afraid of creating money ab nihilo, industrial-scale, because the cost of debt is basically zero.
jayn1321Jan 10, 2021 2:12 AM
Can yield control on the long end fail? If so, how would this take place? Inflation via commodity prices finally via infrastructure spend or helicopter money? I.e. dwindling asset inflation? I may be way off here...
robert.p.balanModeratorLeaderOwnerJan 10, 2021 8:17 AM
jayn1321 -- "Can yield control on the long end fail? If so, how would this take place? "
Under yield curve control (YCC), the Fed would target some longer-term rate and pledge to buy enough long-term bonds to keep the rate from rising above its target. The uses two tools to keep rates lows -- QE and so-called "forward guidance" (i.e. jawboning the market). In the case of YCC, QE would buy longer duration -- which keeps the over-all rate structure lower for longer. This is the last resort of the Fed, now that policy rates are basically zero.
For a practical example, Australia implemented a sort-of YCC last March in response to the COVID-19 emergecy, but it was timid. The RBA did: (1) A reduction in the cash rate target to 0.25 per cent (not zero), and (2) A target for the yield on 3-year Australian Government bonds of around 0.25 per cent (not longer than 5-year, which is the knee (fulcrum) of the yield curve).
YCC is a slight variation of QE, as it targets the PRICES (YIELDS) of bonds, and not on the QUANTITY of bonds bought. It is the supreme forward guidance (signaling device) of the Fed, as presumably they would probably focus on the 7yr bond yield. As what happens when the CB does this, the Fed's target price sooner or later (likely sooner), becomes the market prices. More likely, foreign CBs (which seems to know Fed plans in advance) will front-run the market. and buy long term bonds ahead, and initiate to run lower in yields. The MOTU's get the same information as well.
The idea seems to be to prime the market so the Fed does not have to buy that much long bonds to accomplish their objective (that crimps their leeway in formulating policy). This may be necessary because in YCC, the Fed also says, in forward-guidance-speak, that it will continue doing the buying of long term bonds until they get the levels of long-term yields that they want. Obviously, they would prefer to hold less long duration stuff if they can help it.
The best example, so far in gargantuan scale, is the YCC policy of the Bank of Japan, when it pegged yields on the 10-year bond to circa zero. The BOJ has a standing offer to purchase any outstanding bond at a price consistent with the target yield. Therefore if private investors are less willing to pay that price, the BOJ ends up purchasing more bonds in order to keep yields inside the target price range.
The Fed did YCC during and after WW2. They called it "interest rate peg" at that time. The mechanism works by the Fed capping the Treasury’s borrowing costs though buying any government bond that yielded above a certain level, therefore capping the yield/price. Economic historians say it was very successful, and it is being seen as template for a new YCC, in case the Fed finds it necessary to do so.
"Inflation via commodity prices finally via infrastructure spend or helicopter money?" ----
Let's examine these two charts below-
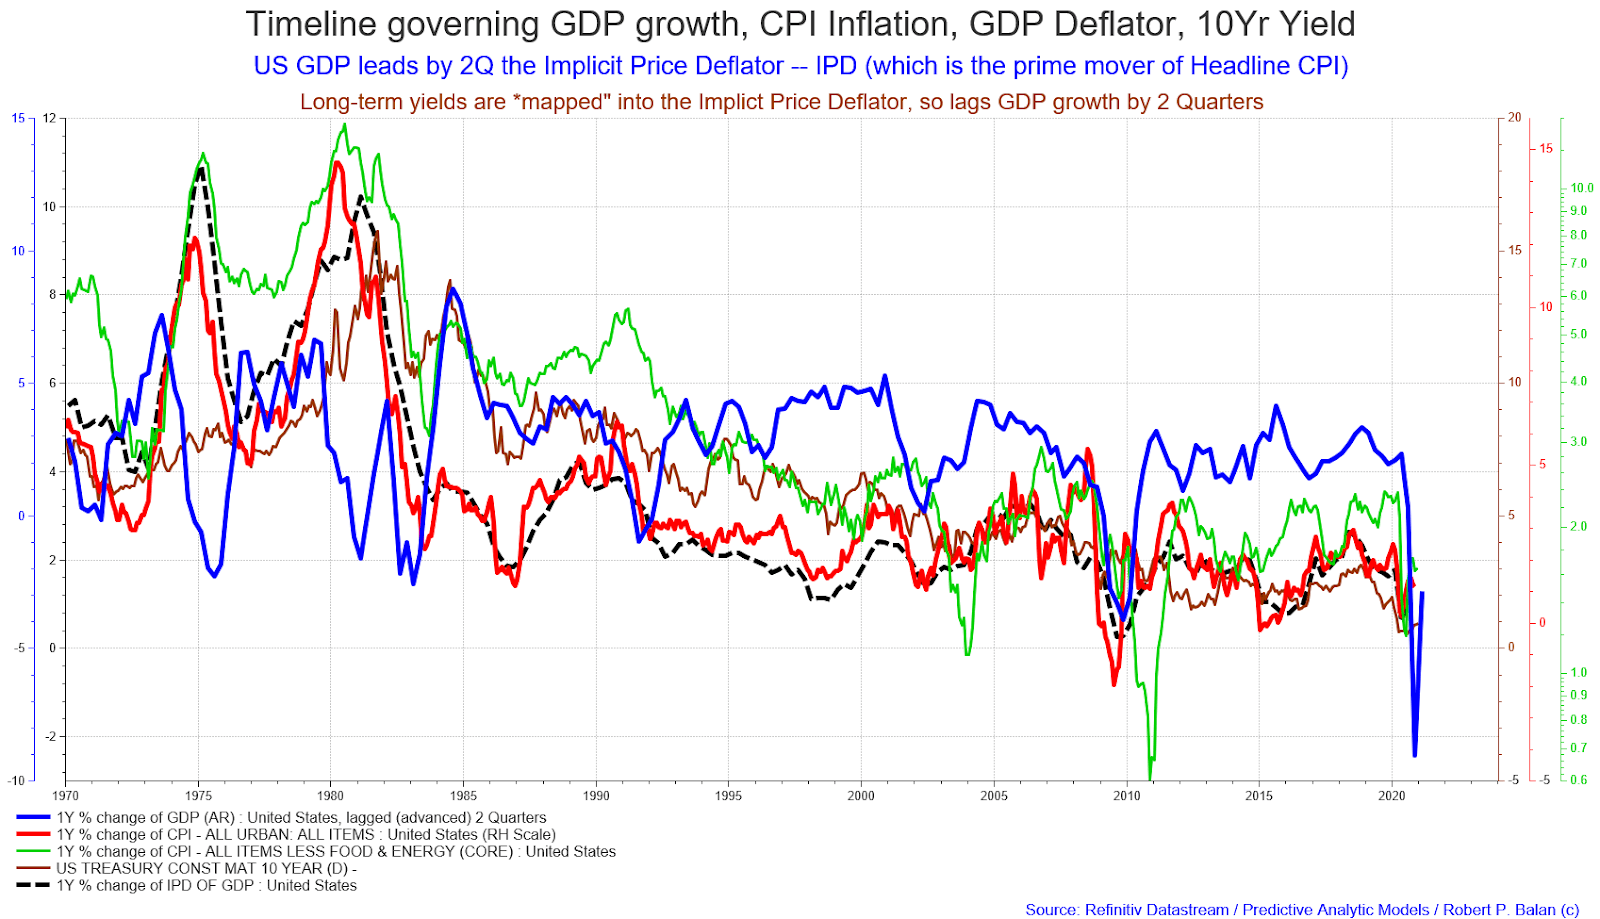
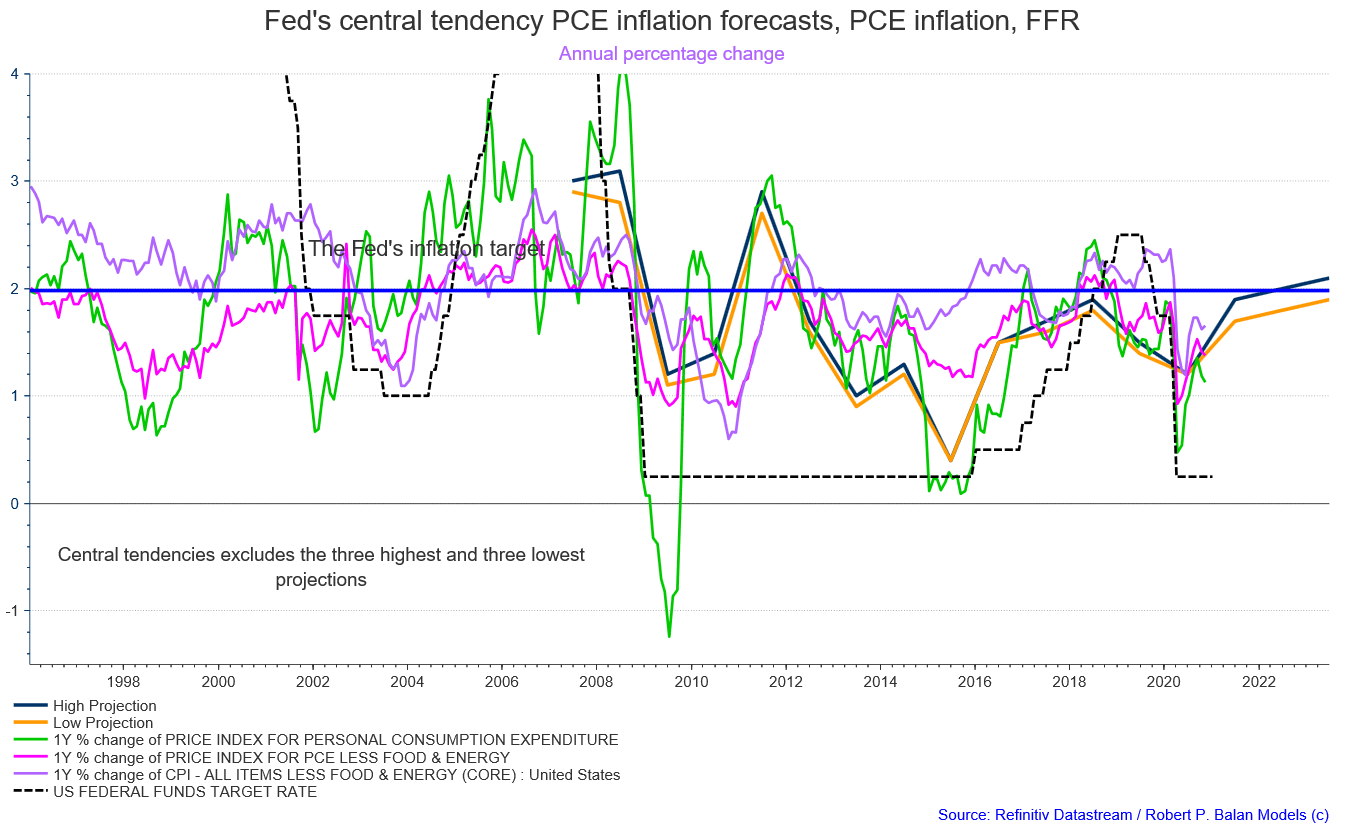
US GDP leads by 2Q the Implicit Price Deflator -- IPD (which is the prime mover of Headline CPI)
Long-term yields are "mapped" into the Implict Price Deflator, so lags GDP growth by 2 Quarters
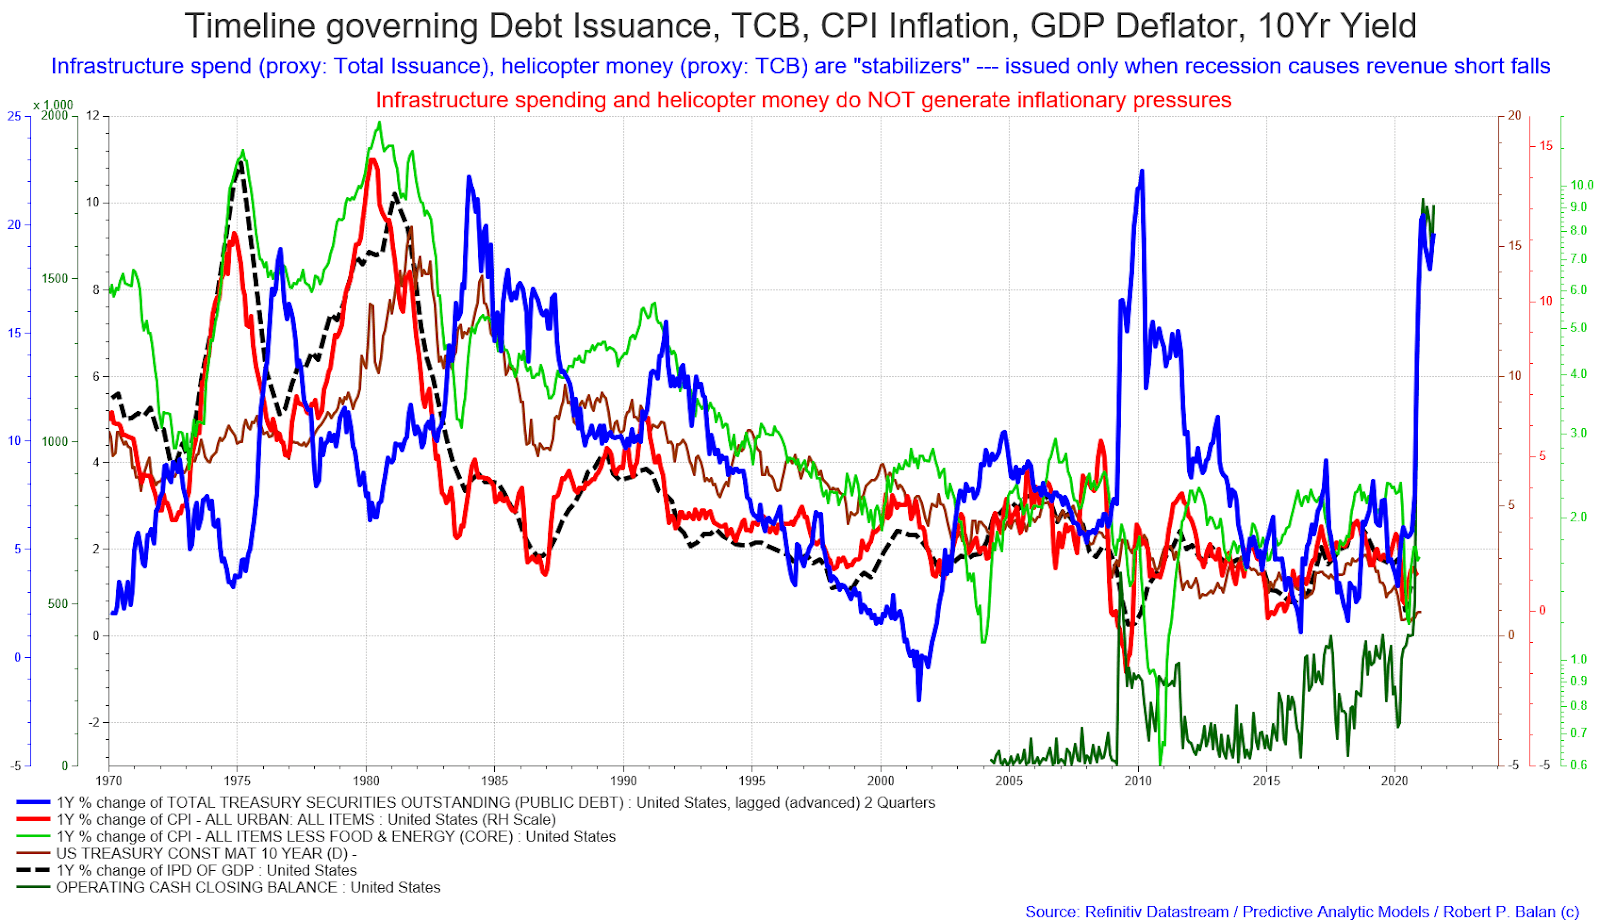
 Infrastructure spend (proxy: Total Issuance), helicopter money (proxy: TCB) are merely economic "stabilizers" --- issued only when growth recession causes revenue short falls.
Infrastructure spending and helicopter money do NOT generate inflationary pressures, per se.
Indeed, historical evidence shows inflation falling when debt issuance and helicopter money were rising, and vice versa.
The ultimate arbiter of this issue is the long bond yield -- it falls during increases in debt issuance -- certainly proving that debt issuance is not a precursor of higher inflation.
(I enrage a lot of Seeking Alpha readers when I make this declarations. I ask them to refute me with their own evidence, but nobody has yet taken the offer).
 Alan.LongbonJan 10, 2021 12:05 PM
Infrastructure spending (human and capital) is inherently deflationary as it lowers the cost of living and doing business and causes the economy to become more efficient overall. Same with technology innovation.
robert.p.balanJan 10, 2021 12:06 PM
Bravo Mr. Longbon!
That is why it is important to produce the optics necessary to confirm or denigrate these narratives. This is one such time.
Manu.PJan 10, 2021 9:01 AM
A question, Robert. What could generate inflation (if consumer or infrastructure spending can not )...
robert.p.balanModeratorLeaderOwnerJan 10, 2021 9:01 AM
Internal growth, Manu.P -- GDP has to rise. That is why CPI inflation and long term yields are "mapped" to the Implicit Price Deflator -- which is the internal measure of what kind of inherent inflation the economy is producing.
I hope the weather outside does not improve from so-so to good, so I don't fell compelled to go outside. I love doing this musing stuff.
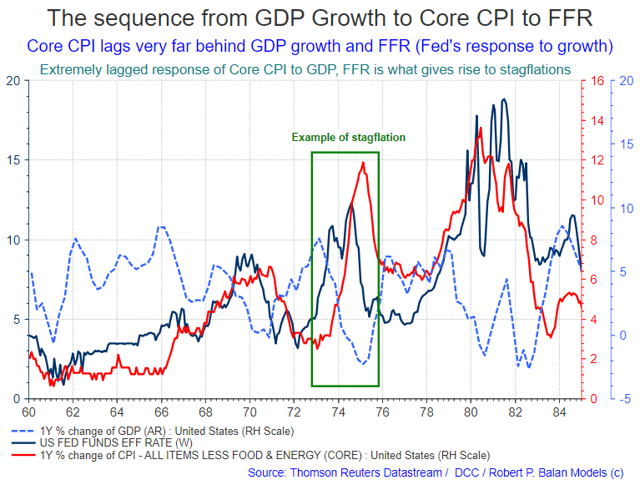
Oh there was one very smart guy who said that if this is the case, why do we get *stagflation"? I rate the IQ of that guy at 300. Very good question.
That question compelled me earlier to write this old SA article:
What's Up With Core Inflation? Core CPI Will Rise Over The Next 5-6 Quarters: Actionable Ideas
There is so much misplaced mystique over Core CPI, which should not be the case - it is merely a very lagged function of GDP growth.
robert.p.balanModeratorLeaderOwnerJan 10, 2021 9:20 AM
"The very lagged response of core inflation to growth is what gives rise to one of the least understood economic phenomena - stagflation. This economic equivalent of a lose-lose situation happens because the lagged response of core inflation does not correspond to the general business cycle (see graph below). That is exacerbated further by the very late reaction function of the Federal Reserve to the changes in growth and changes in core inflation. The relationships among these three variables are circular, but they are not non-linear."
 I got a DM asking why I am focused on the Capital Account, when according to economists, it is the Trade Account Balance which impacts the US Dollar. He showed this chart to me.
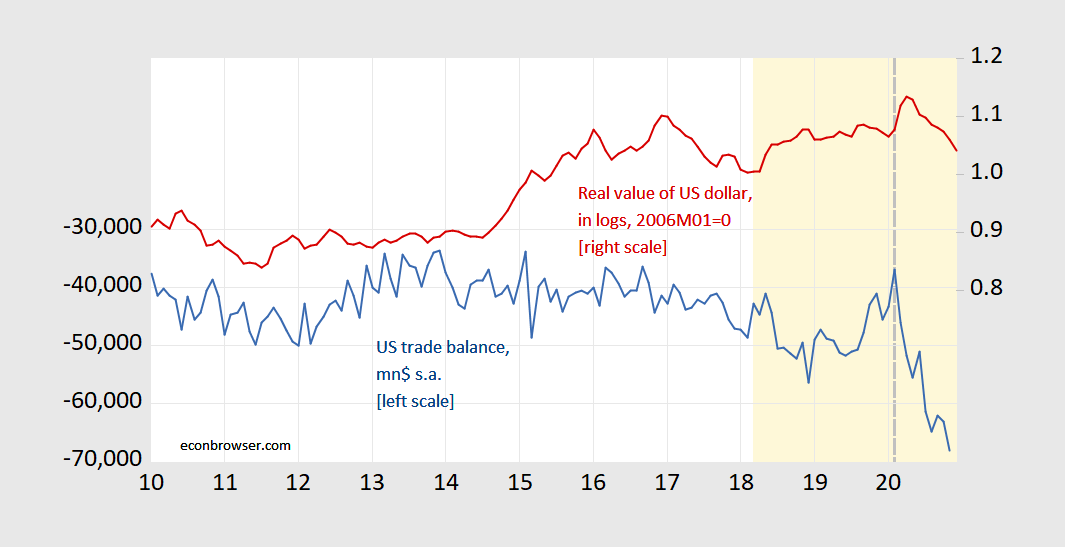 Figure 2 chart (above) is wrong -- it just took a sample when the correlation supported the author's preconceived notions -- not uncommon for many economists.
This is how that chart looks long term:
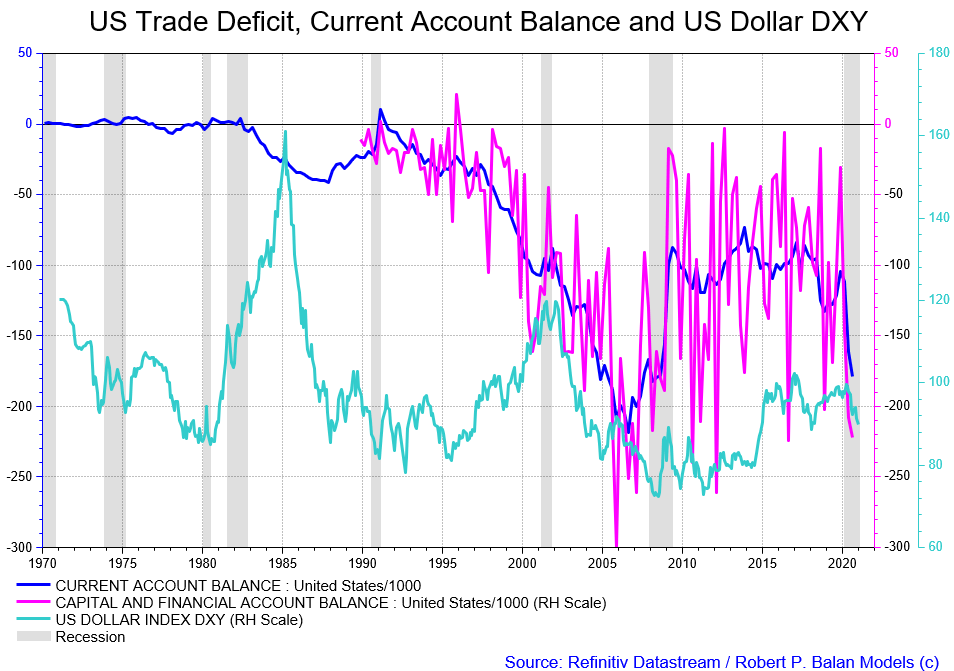 It it is true that expanding trade deficit weakens the Dollar, why was the Dollar surging in the late 1990s when the deficit was expanding the most?
The reality is many economists take a sample when the correlation supported the author's preconceived notions -- that's not uncommon for many economists, but it is intellectual dishonesty.
The reality is that it is the Capital Account Balance, not Trade, which makes a better correlation with the Dollar. But the effect on the Dollar has a long lag. A simple regression procedure will show this.That is why this earlier chart is correct.
Infrastructure spend (proxy: Total Issuance), helicopter money (proxy: TCB) are merely economic "stabilizers" --- issued only when growth recession causes revenue short falls Infrastructure spending and helicopter money do NOT generate inflationary pressures, per se.
Indeed, historical evidence shows inflation falling when debt issuance and helicopter money were rising, and vice versa. The ultimate arbiter of this issue is the long bond yield -- it falls during increases in debt issuance -- certainly proving that debt issuance is not a precursor of higher inflation.
(I enrage a lot of Seeking Alpha readers when I make this declarations. I ask them to refute me with their own evidence, but nobody has yet taken the offer).
Infrastructure spending (human and capital) is inherently deflationary as it lowers the cost of living and doing business and causes the economy to become more efficient overall. Same with technology innovation.
The reality is that it is the Capital Account Balance, not Trade, which makes a better correlation with the Dollar. But the effect on the Dollar has a long lag. A simple regression procedure will show this.
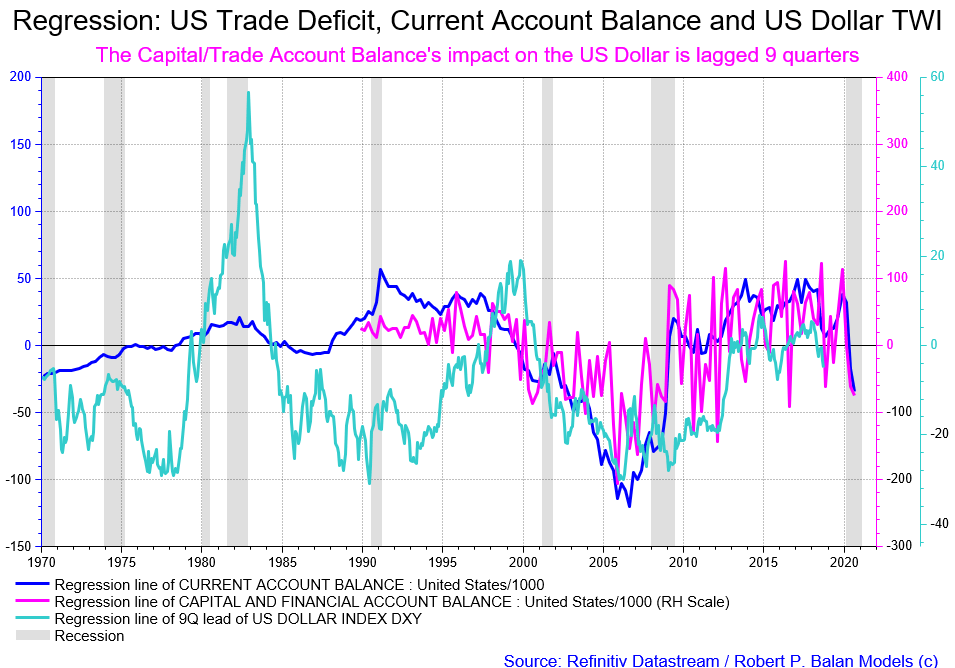 That is why this earlier chart is correct.
 robert.p.balanModeratorLeaderOwnerJan 10, 2021 12:14 PM
Weather turned out for the much better. See you guys tonight.
jayn1321Jan 10, 2021 4:18 PM
 From Analytics
Alan.LongbonJan 10, 2021 4:48 PM
You can see there how the cap inflows follow the treasuries creation with a lag.
paradigmJan 10, 2021 8:54 PM
Just want to comment on the IMF call for Global GDP to keel over in the first Q of 2021: I subscribe to a macro service that tracks GDP in at least 50 economies at a granular level. Their prediction is exactly the opposite of the IMF. Their call is for a strong quarter, and most probably 2 quarters, for both growth and inflation globally. I trust their process more than I trust the IMF.
robert.p.balanModeratorLeaderOwnerJan 10, 2021 9:22 PM$
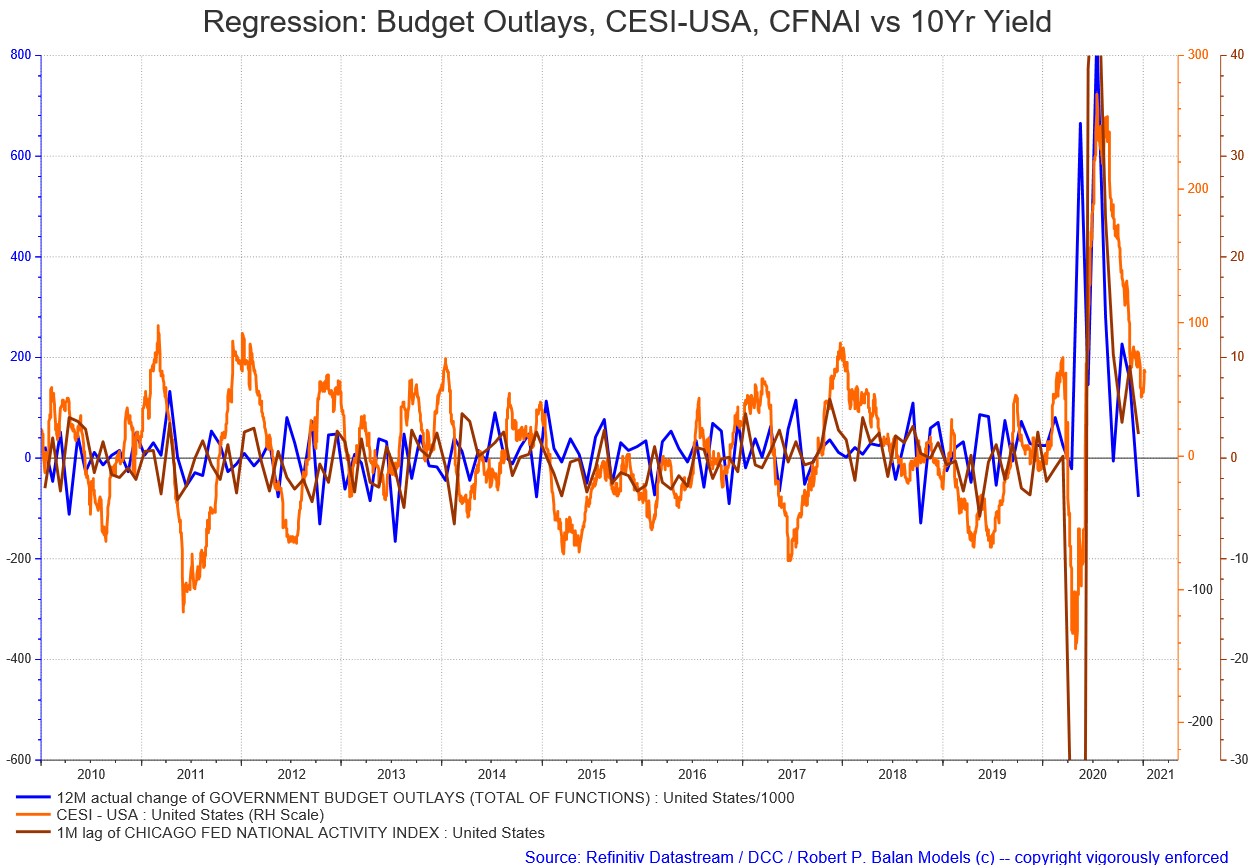 I am sure its all about the trillions of stimulus trumping the macro situation for them. The government has slackened on expenditures, the CESI is plunging, and the CFNAI is about to go negative. Those trillions of stimulus will impact the economy in about six months -- H2 2021 will be great. But Q1 2021 is dicey.
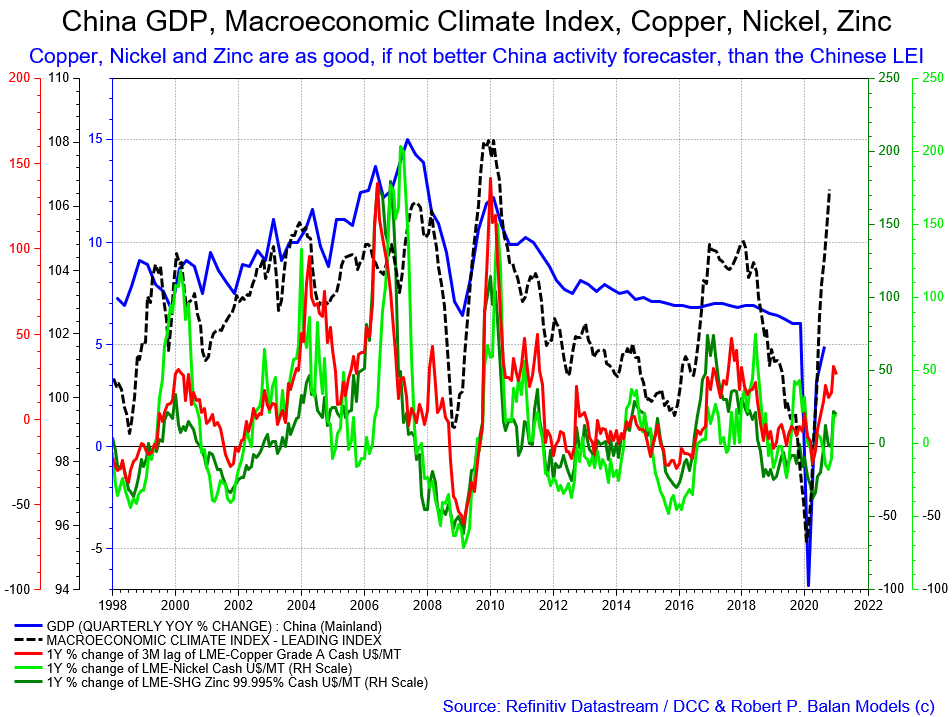
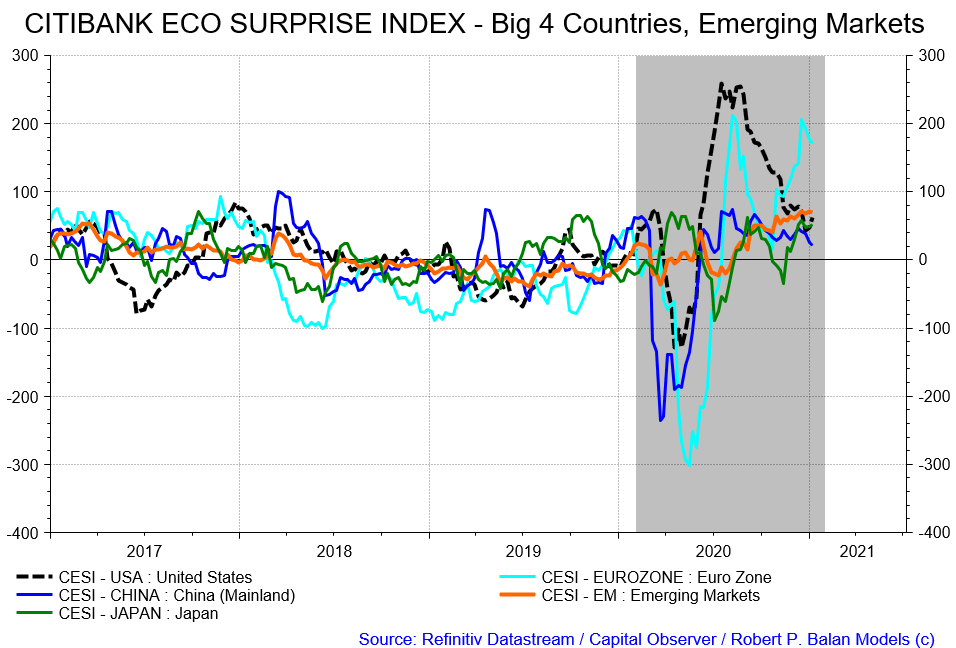
Global growth is powered by that China spectacular leap in growth. And with no inflation.
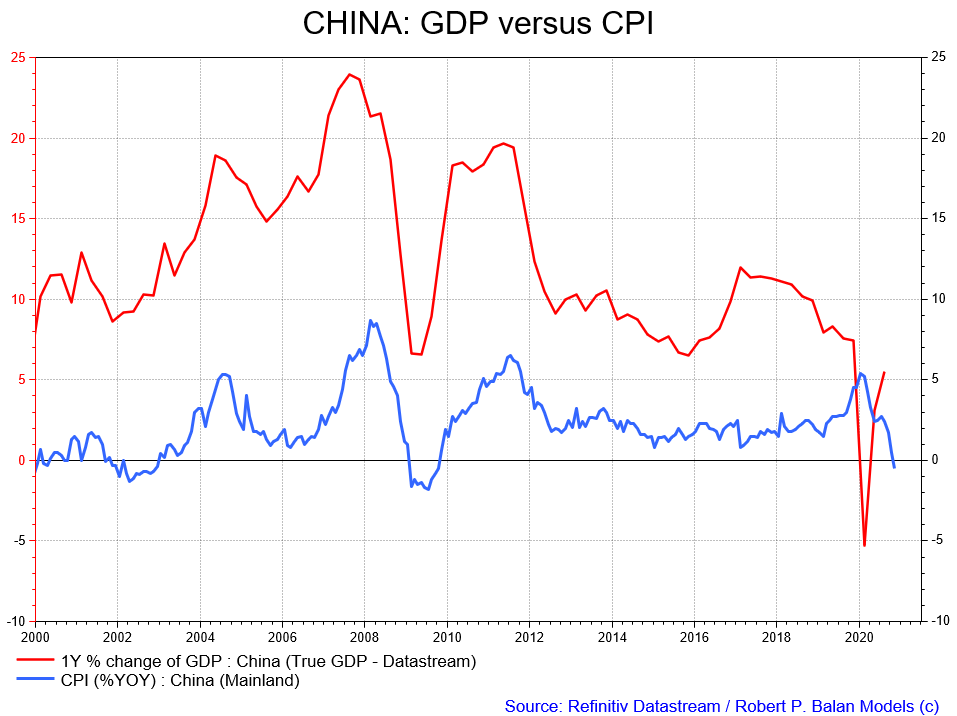 However, the China Citi Eco Surprise Index is decidedly tame -- more like the inflation data in China.
 robert.p.balanModeratorLeaderOwnerJan 10, 2021 9:48 PM
The reality is that the global economy is still in the grips of deflation.
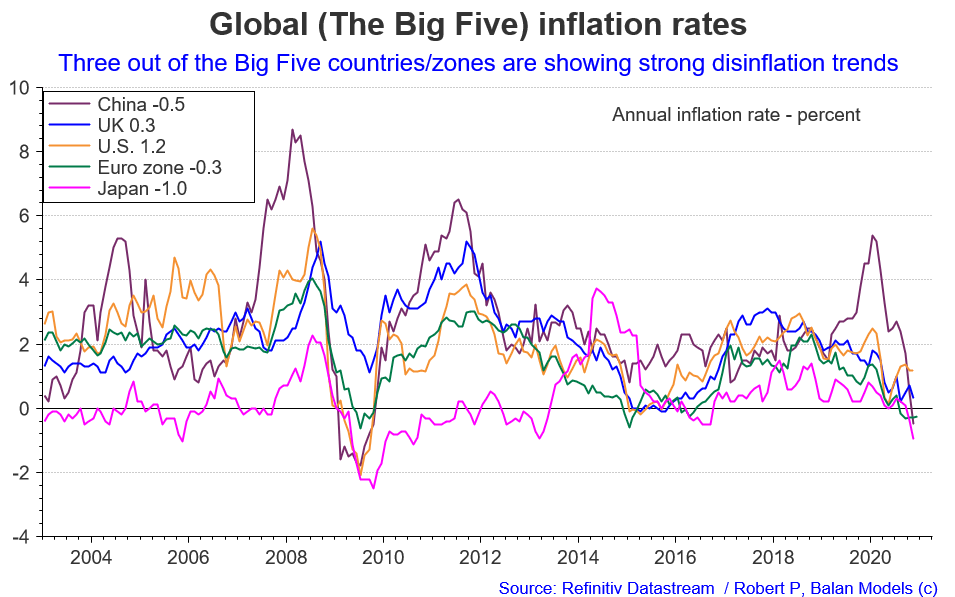 No wonder why Global Bond Yields still manifest that deflationary tendency.
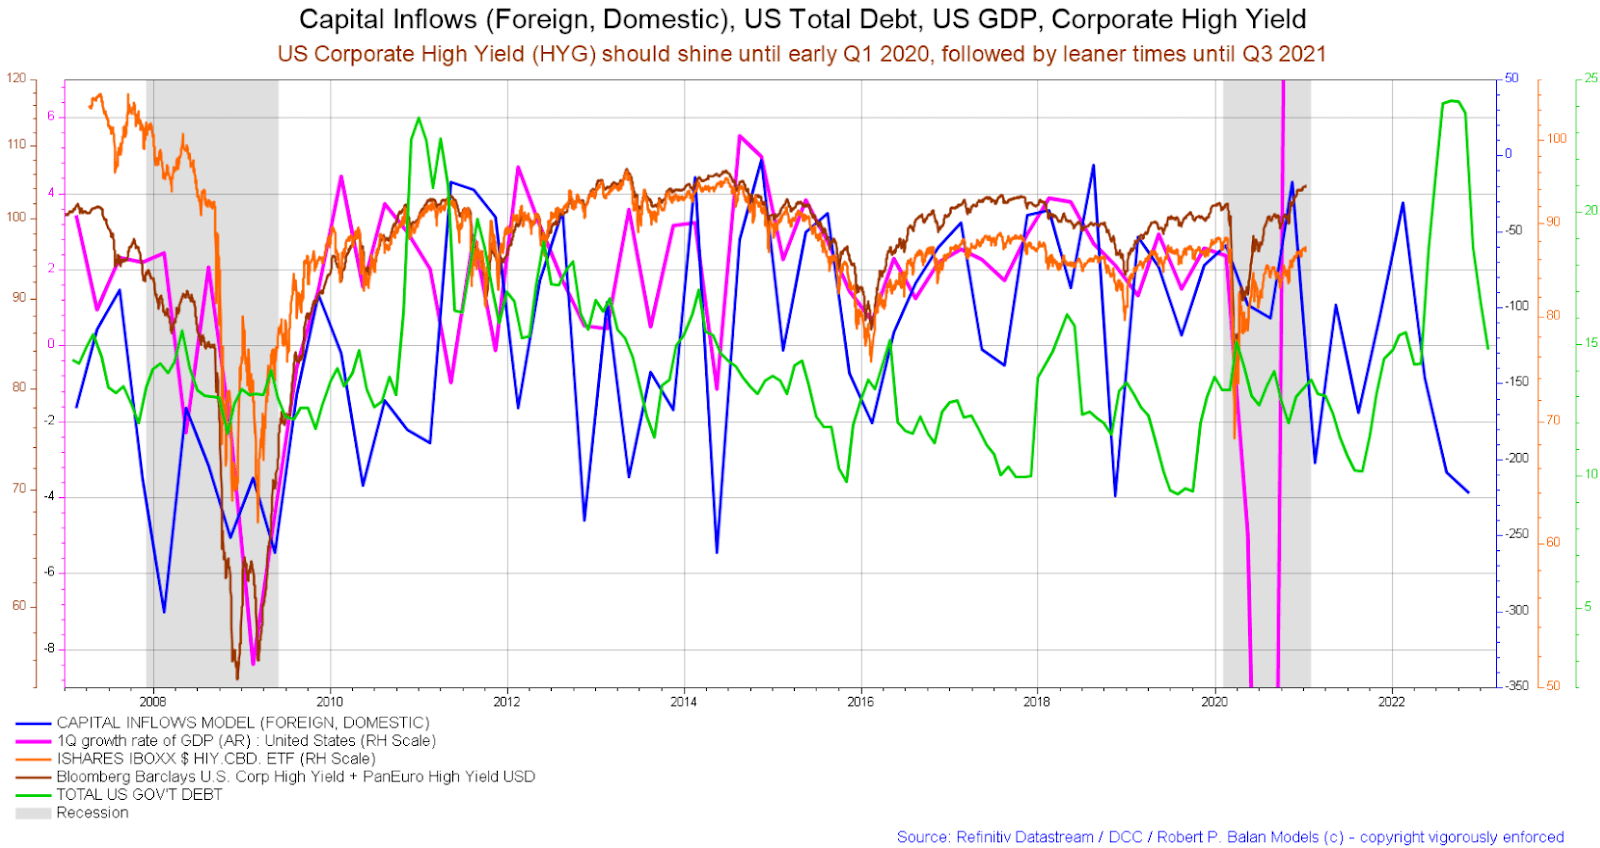
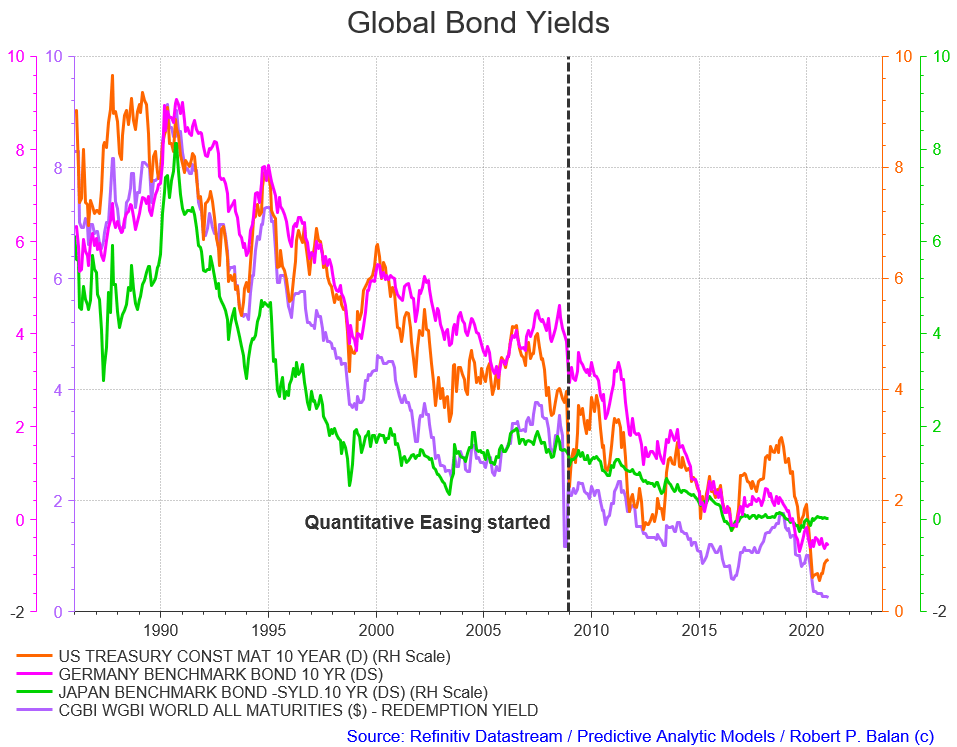 So the global bond bull market is dead? Not from what I am looking at -- may be that will change by Q3 2021. By then the Biden goivernment's trillions in helicopter money would have kick-started the US economy.
robert.p.balanModeratorLeaderOwnerJan 10, 2021 10:04 PM
Mr Alan Longbon loves this chart.
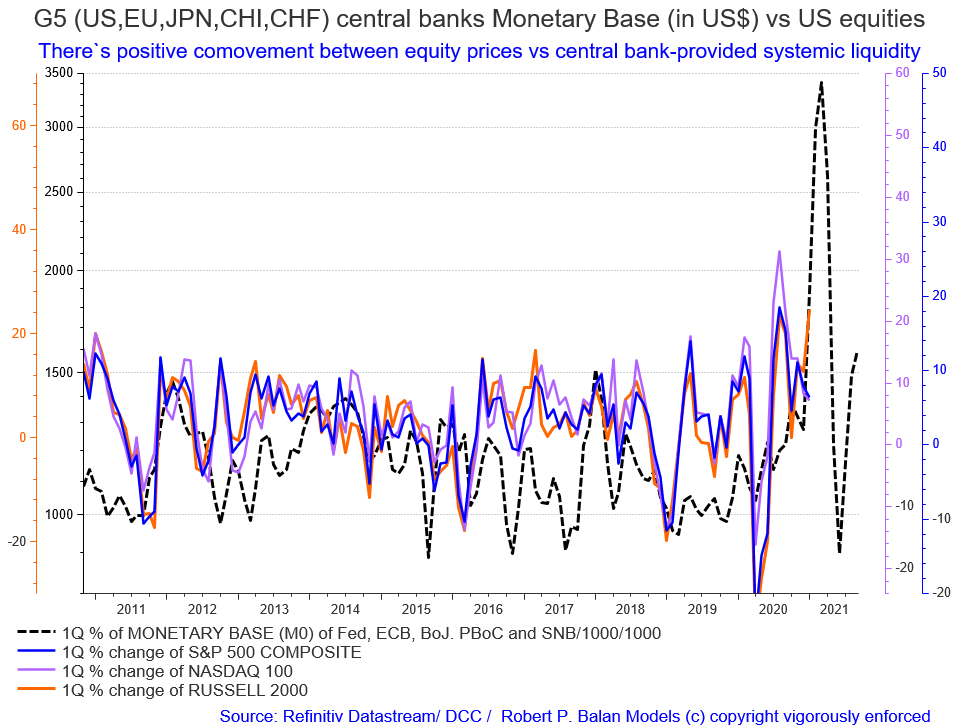 robert.p.balanModeratorLeaderOwnerJan 10, 2021 10:05 PM
This illustrates the impact of the Global QE on stock markets (US).
Alan.LongbonJan 11, 2021 6:56 AM
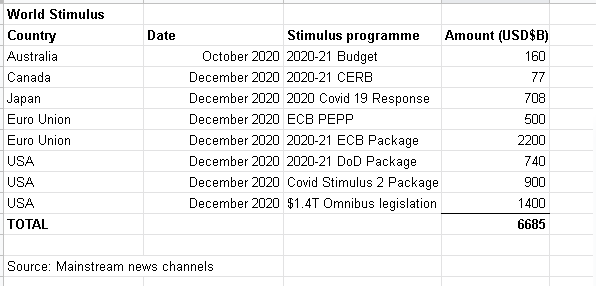 And there is still all of this place the contents of the unspent $1.5T still to come.
robert.p.balanModeratorLeaderOwnerJan 10, 2021 10:18 PM
It may be only by Q4 2021 when the Fed's 2% inflation target is reached.
kiraninvestorJan 11, 2021 12:04 AM
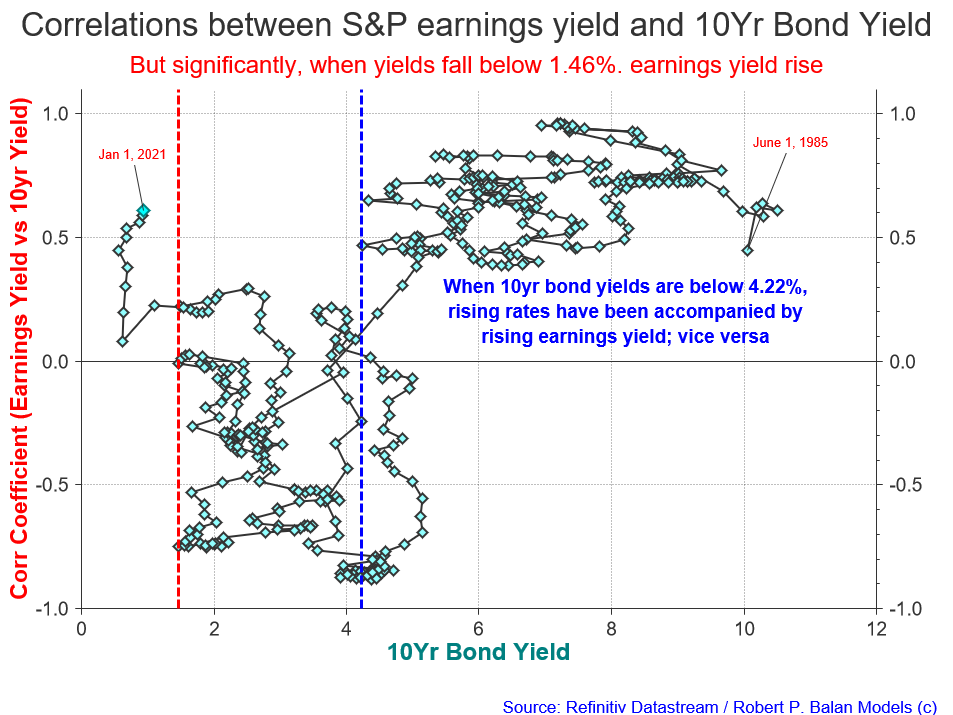
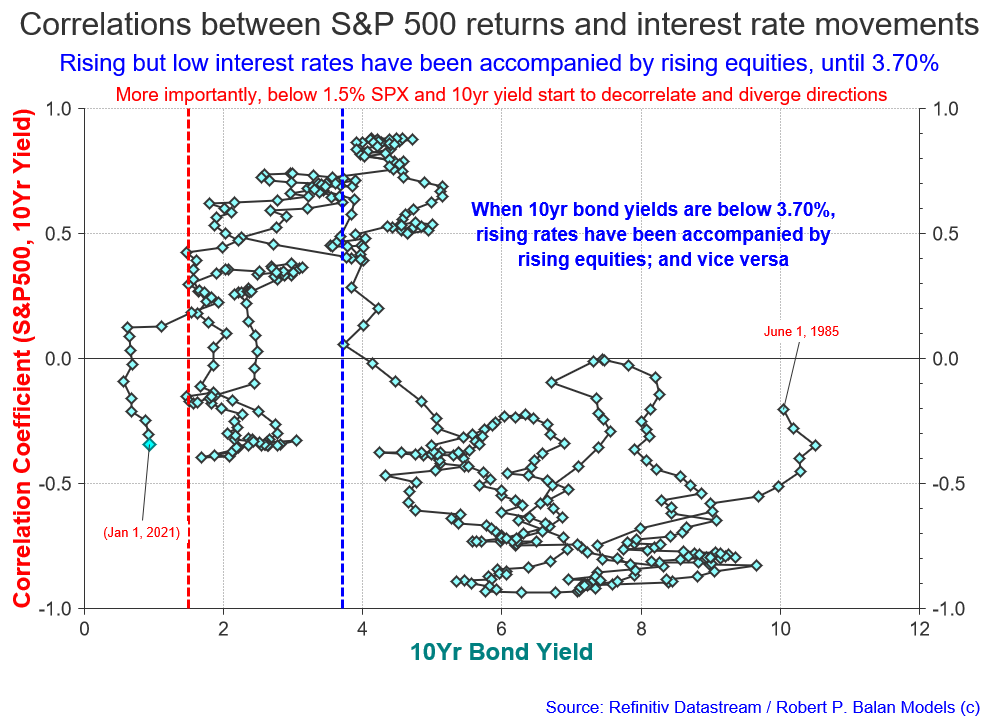
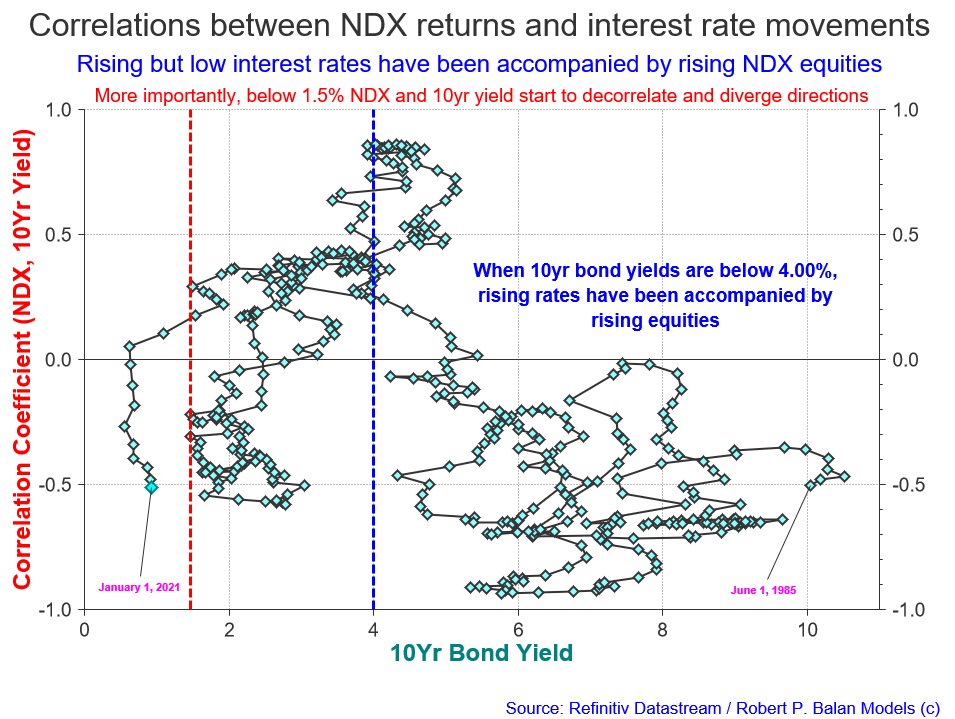
robert.p.balan ...You had a chart that showed the correlation of stocks to interest rate changes depending on the range of the interest rate. could you publish it. I promise..I will save it.
robert.p.balanModeratorLeaderOwnerJan 11, 2021 4:47 AM
kiraninvestor sure KI. I will also add others.
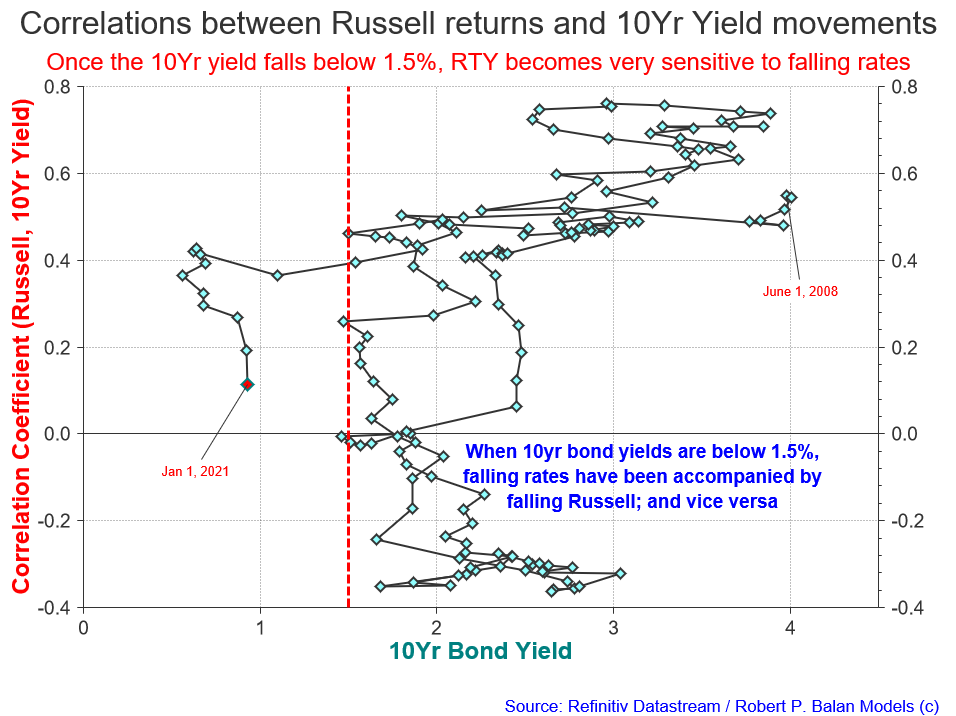
robert.p.balanModeratorLeaderOwnerJan 11, 2021 11:30 AM
If we do get a decline in yields as the macro and liquidity models suggest. the Russell Index will be very vulnerable, as the chart immediately above suggests.
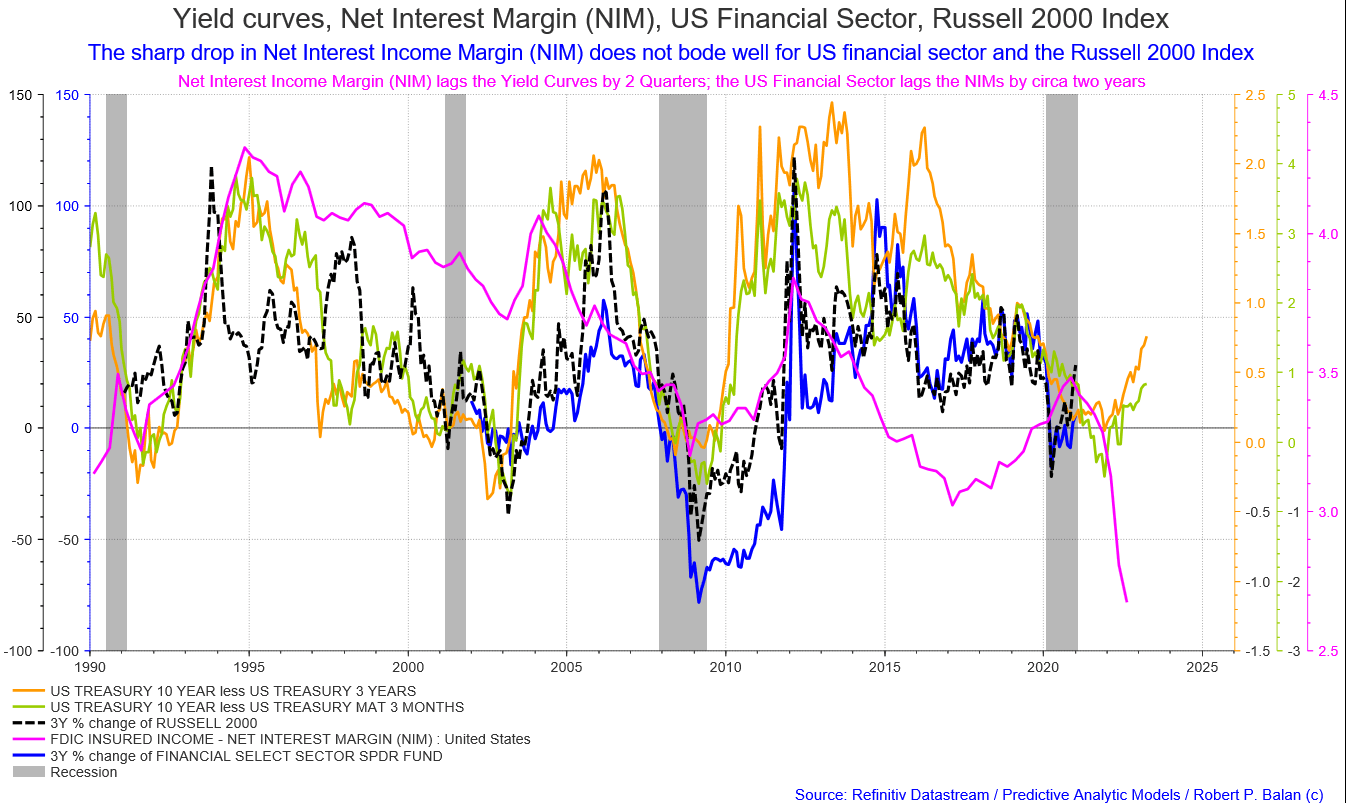 It also does not help that Net Interest Margin has collapsed. depriving regional banks much of their income from leveraging deposits.
robert.p.balanModeratorLeaderOwnerJan 11, 2021 11:43 AM
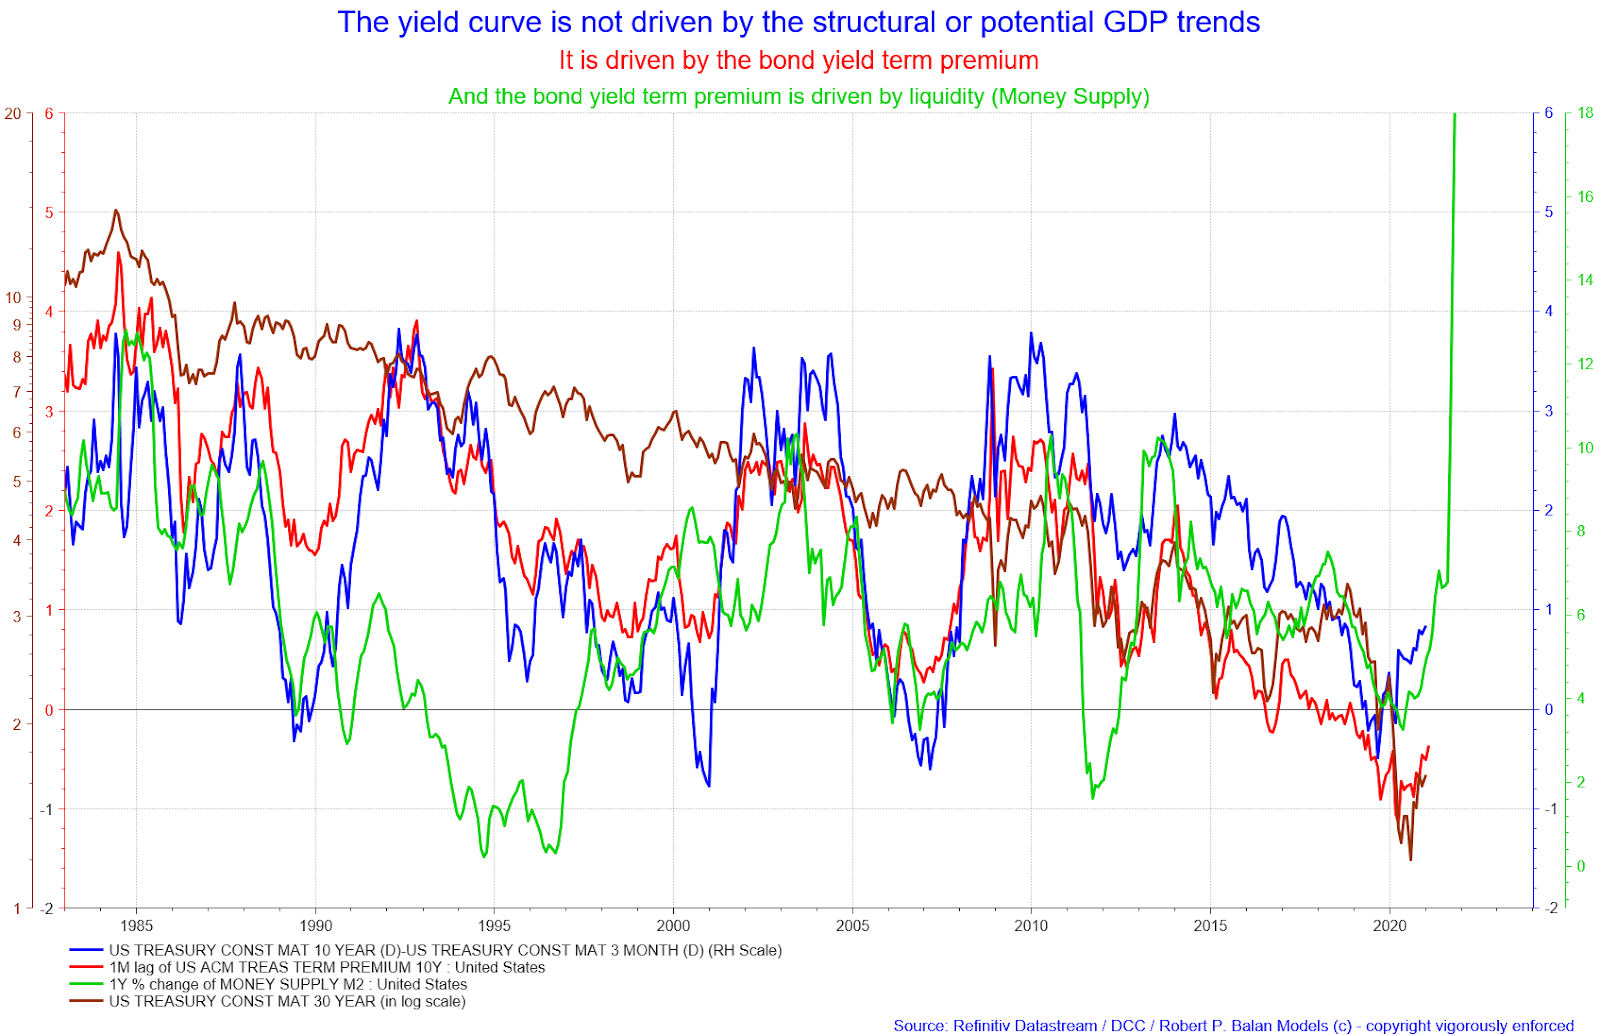
bryanlan -- You asked: "RB, thanks for extremely informative posts in main channel. Am I correct in inferring that this is probably not a good time to enter steepening trade if we expect govt to issue massive debt this year (and keep long rates low) given that short term rates are near zero bound?"
The yield curve is not driven by the structural or potential GDP trends.
It is driven by the bond yield term premium.
And the bond yield term premium is driven by liquidity (Money Supply)
robert.p.balanModeratorLeaderOwnerJan 11, 2021 12:02 PM
findependence - "I understood GC low BTC high is a temporary situation that will reverse when the reset is done. Did I get it right?."
It is a temporary situation.
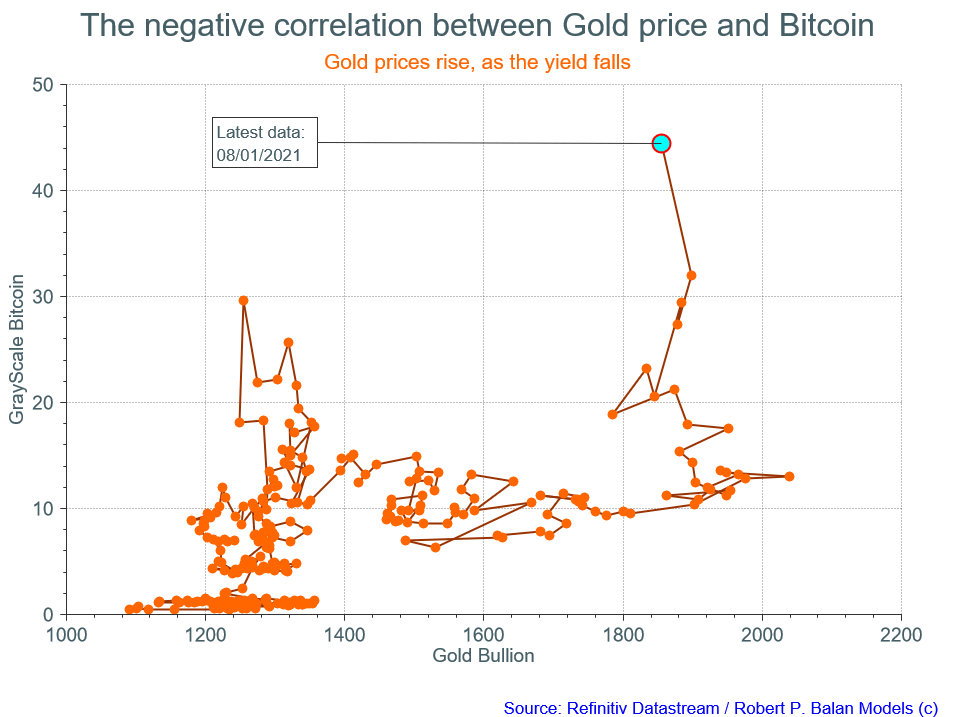 robert.p.balanModeratorLeaderOwnerJan 11, 2021 12:04 PM
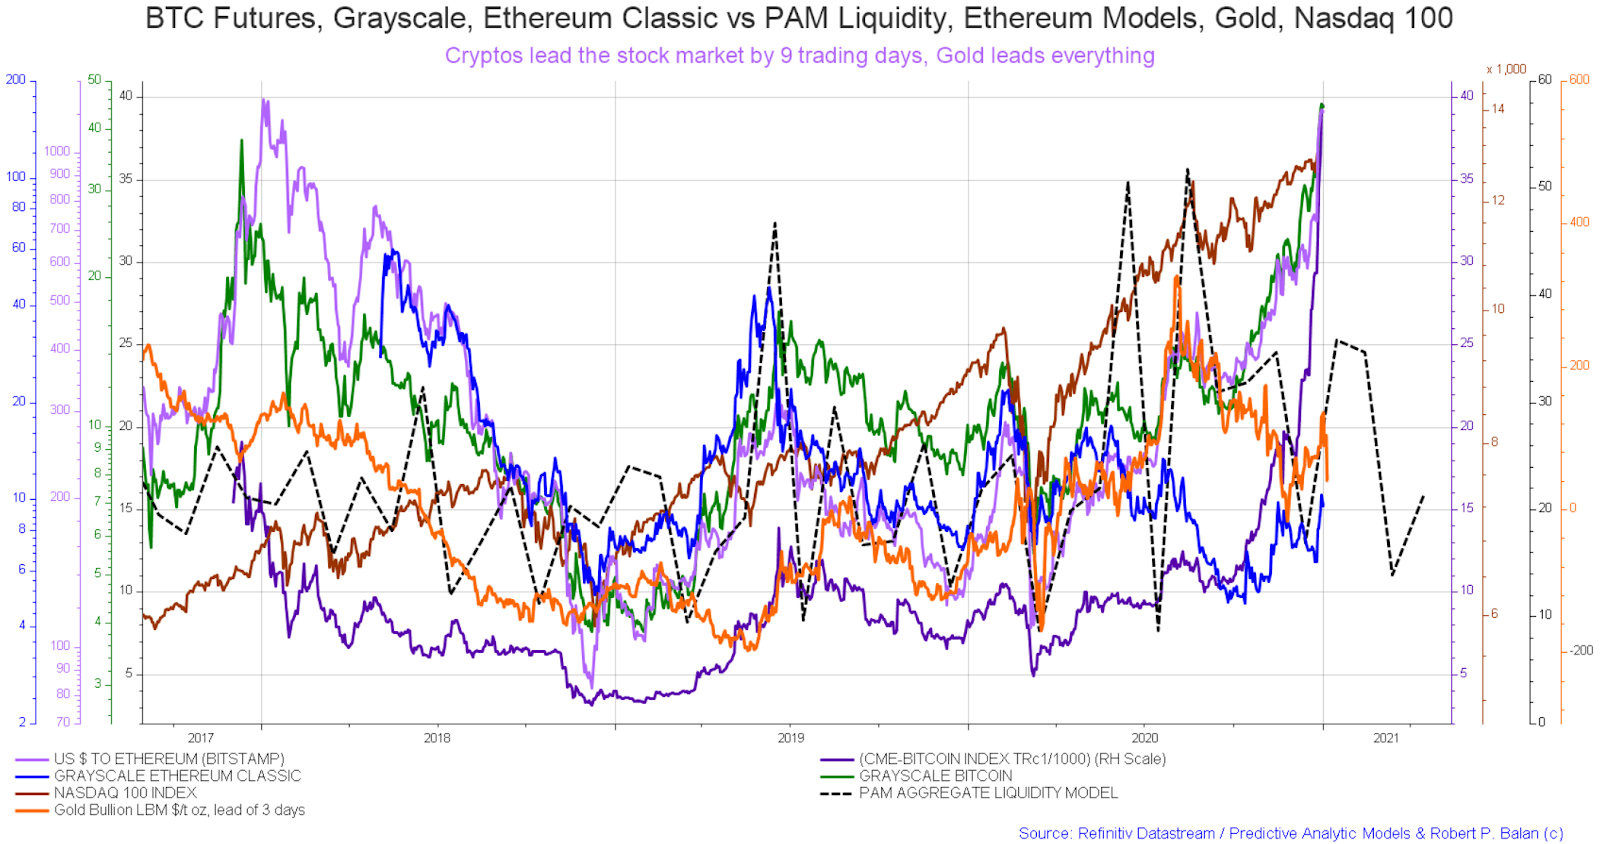
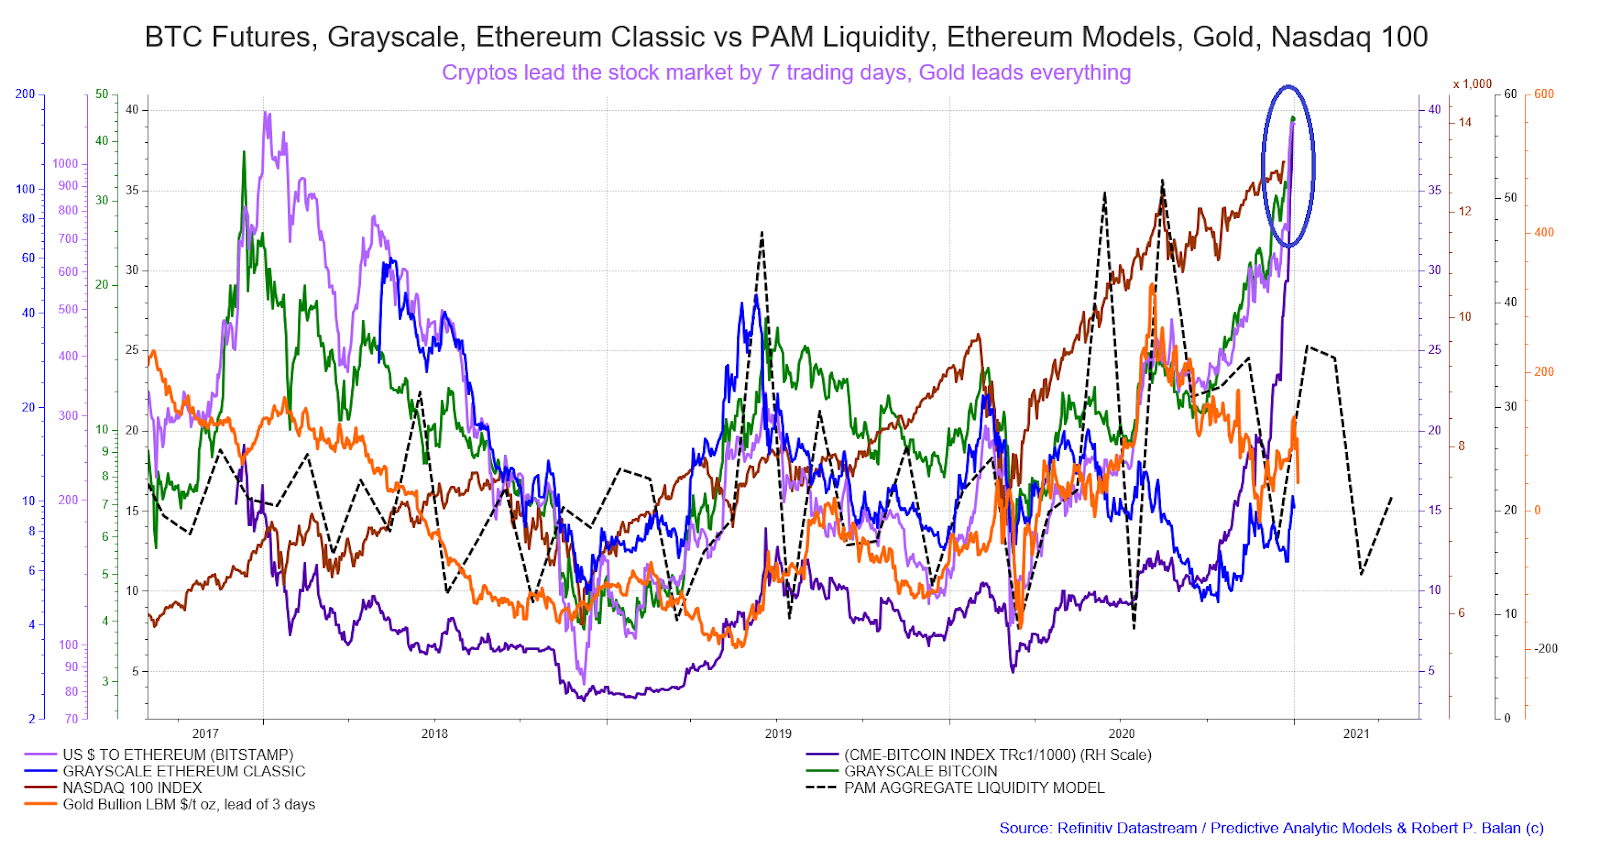
Cryptos lead the stock market by 7 trading days, Gold leads everything.
This chart is at the PAM Analytics channel.
 robert.p.balanModeratorLeaderOwnerJan 11, 2021 12:21 PM
It is the growth of China Quasi Money Supply (issues by Shadow Banking) which powers cryptos.
It is the lagged effect of China Total Social Financing allocations which powers Quasi Money Supply.
The crypto rally is powered by liquidity "leaving" China.
It is the world's greatest money-laundering mechanism. It went into overdrive, after Jack Ma of Alibaba "disappeared". Nine days later, it plows into the US equity markets. (MOTU's loose talk, may not be true, or maybe it is)._
This is how equities relate to cryptos when the lag is removed.
And by the way, our new tool -- Securities Lent To Primary Dealers is proving to be a boon. This is the background info on this alternative way of gauging the amount of liquidity in the system:With increasing levels of QE, the Fed started to lend less securities to Primary Dealers which are now flush with cash - and buy the securities themselves, rather than borrow those securities temporarily from the Fed (see chart below).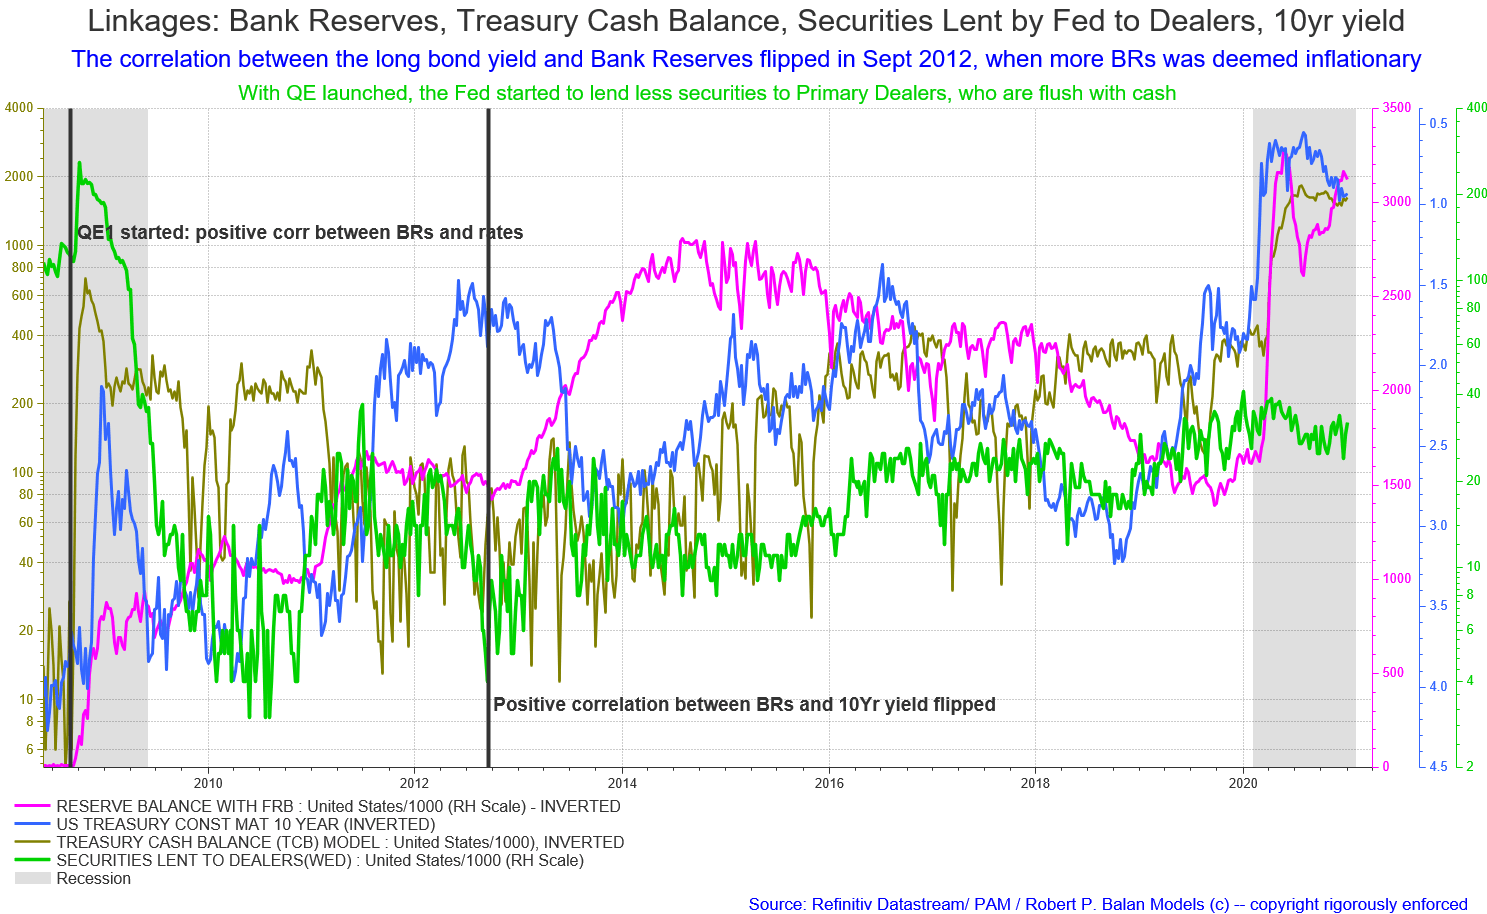 It turned out that by not lending securities to Primary Dealers, the Fed has made dis-functional one tool with which to tighten liquidity. Therefore, rising bank reserves plus falling securities lending optimized the negative correlation between rising liquidity and rising bond yields (falling bond prices), and vice versa (see chart above).
In fact, the change rate of the Fed's securities lending has given us a benchmark to judge how tight or loose systemic liquidity is. And it has become a super tool for us because it leads the changes in bond yields by several weeks (see chart below).
End of musings. We will do it again next week!
