


Summary
- Looks like Gold finally formed a viable bottom. Time to take out the short hedge. We look to reinstate short Gold hedges higher. DXY now leads Gold by one day.
- PAM adds to long RTY and YM positioning, looking for (temporarily) rising yields to push value sector market levels higher.
- We are probably within two days from completion of the five-wave sequence in 10yr yield from the circa 1% trough on Jan 28.
- That may mean we are also within two days of completing the equity rally from Jan 31. If we are to get the two day lag of equities to yields, that peak may be extended to take place three to four days longer.
- The models' behavior also suggest to us that we will probably see the peak inflection point of the 10yr's change rate in two days -- which happens to correspond nicely with the EWP projections. The seasonality of liquidity outflows (of the Fed Balance sheet) historically lasted 24 Trading Days from peak to bottom. That suggests circa 5 weeks of sideways to lower 10yr yields.
------------------------------------------------------------------------------------
---------------------------------------------------------------------------------------- Here is the current status of the PAM flagship Swing Fund, which includes open and closed trades.
During the twelve months of 2020, PAM delivered phenomenal real-dollar Hedge Fund trading performance, the best at Seeking Alpha:
PAM's flagship Swing Portfolio, year-to-date (December 31, 2020) delivered $100, 181,522.77 net profit on $11,172,813 margin capital.
Year-to-date performance: 860.27%, on 888-98 win-loss trades.
January 2021 spreadsheet here:
Year to date 2020 spreadsheet here.
--------------------------------------------------------------------------------------
FEBRUARY 8, 2021
GOOD MORNING ASIA / GOOD EVENING EAST COAST
robert.p.balanModeratorLeaderOwnerFeb 8, 2021 12:31 AM
Looks like Gold has finally formed a viable bottom. Time to take out the short hedge. We look to reinstate short Gold hedges at higher levels.
nanobrainFeb 8, 2021 3:04 AM
Robert, why are you closing short gold when we expect yields higher next 3-5 TD (means gold lower)?
robert.p.balanFeb 8, 2021 9:57 AM
I am closing the short HEDGE. Gold is again having a positive covariance with equities. Maybe we can reset the short hedge at higher levels.
Higher yield equating to lower gold is not a given -- it is a very unstable correlation in the very short term, and is the case today.
The more stable negative relationship is with the DXY -- and DXY likely to go down short term. DXY leads Gold by one day today.
robert.p.balanFeb 8, 2021 9:57 AM
all PAM BUYS BACK 1500 CONTRACTS OF GCH1 AT 1800 LIMIT OR BETTER, OR AT BREACH OF 1825, OCO, FOR ALL FUNDS
robert.p.balanModeratorLeaderOwnerFeb 8, 2021 2:41 AM
OK -- looks like all going well, so I will see you at Europe Open. GN everyone.
robert.p.balanModeratorLeaderOwnerFeb 8, 2021 3:19 PM
PAM BUYS BACK 1500 CONTRACTS OF GCJ1 AT 1800 LIMIT OR BETTER, OR AT BREACH OF 1825, OCO
*This order was filled.*
*GCJ1 --- 1825.45 BOUGHT BACK 1500 CONTRACTS GCH1 TO EXIT SHORT HEDGE FOR LONG GC TRADES, ALL FUNDS*
rcmaiFeb 8, 2021 3:54 PM
We think you may mean GCJ21 as that is the front month and has all the liquidity, our platforms show March has barely traded.
vjapnFeb 8, 2021 4:00 PM
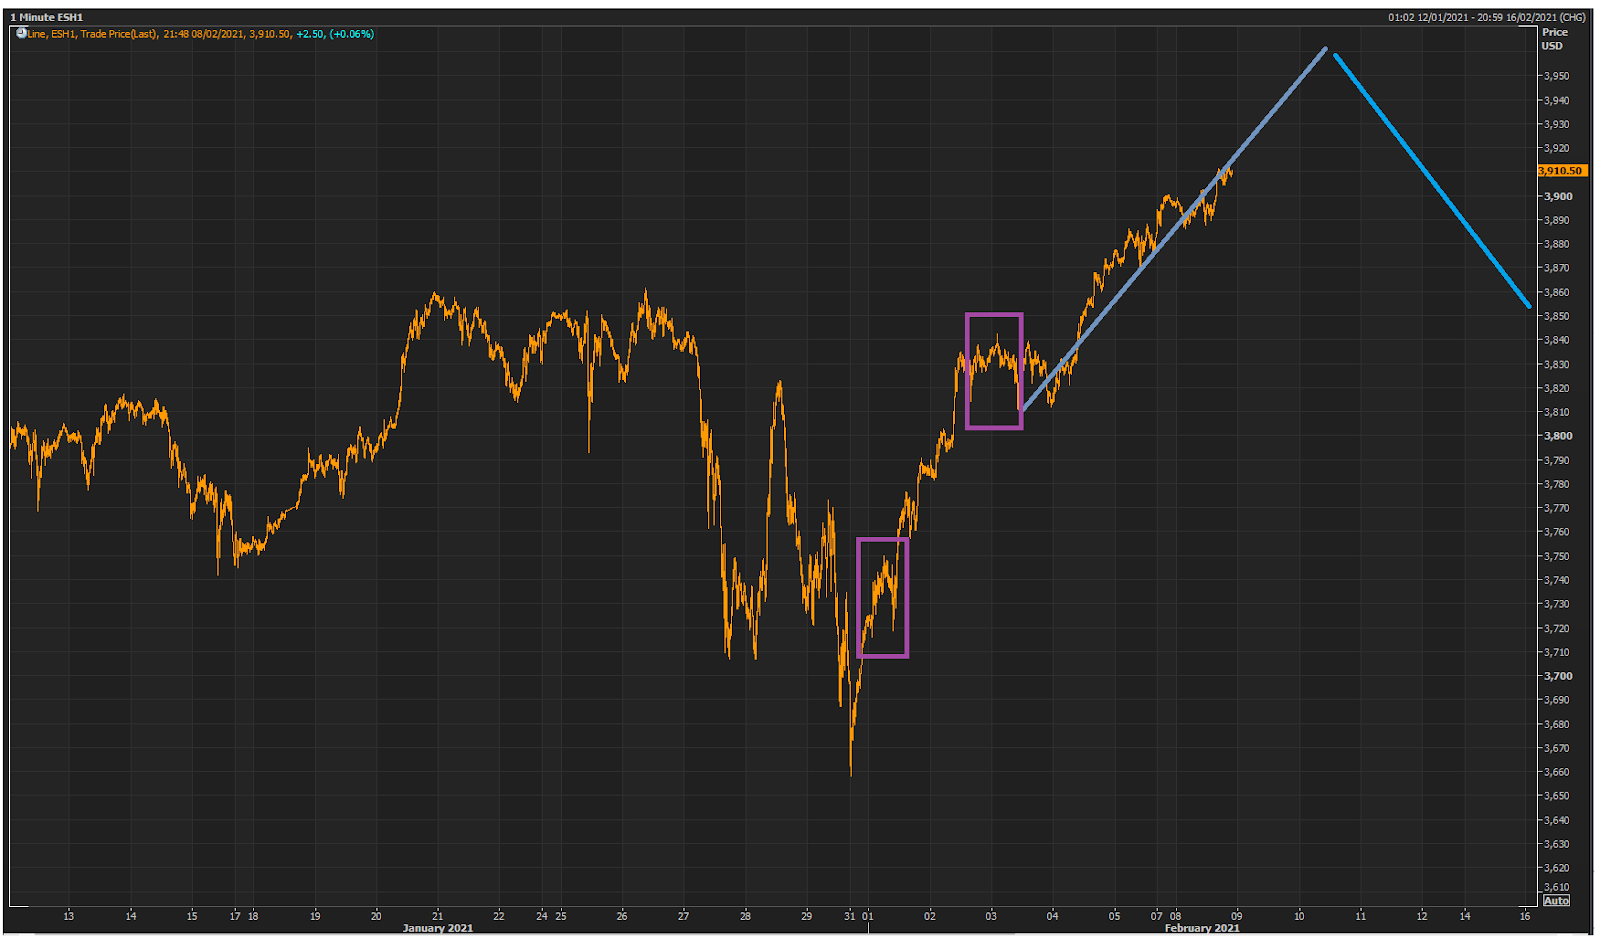
Robert, Can you please update the ES and RTY EWP pattern? RTY is on a rocketship
robert.p.balanModeratorLeaderOwnerFeb 8, 2021 4:20 PM
Yes, RC .. my mistake -- its GCJ1. Thats the roll over month.
rcmaiFeb 8, 2021 4:22 PM
Just mentioned for any of the newer followers. Thank you.
robert.p.balanModeratorLeaderOwnerFeb 8, 2021 4:24 PM
vjapn
robert.p.balanModeratorLeaderOwnerFeb 8, 2021 4:25 PM
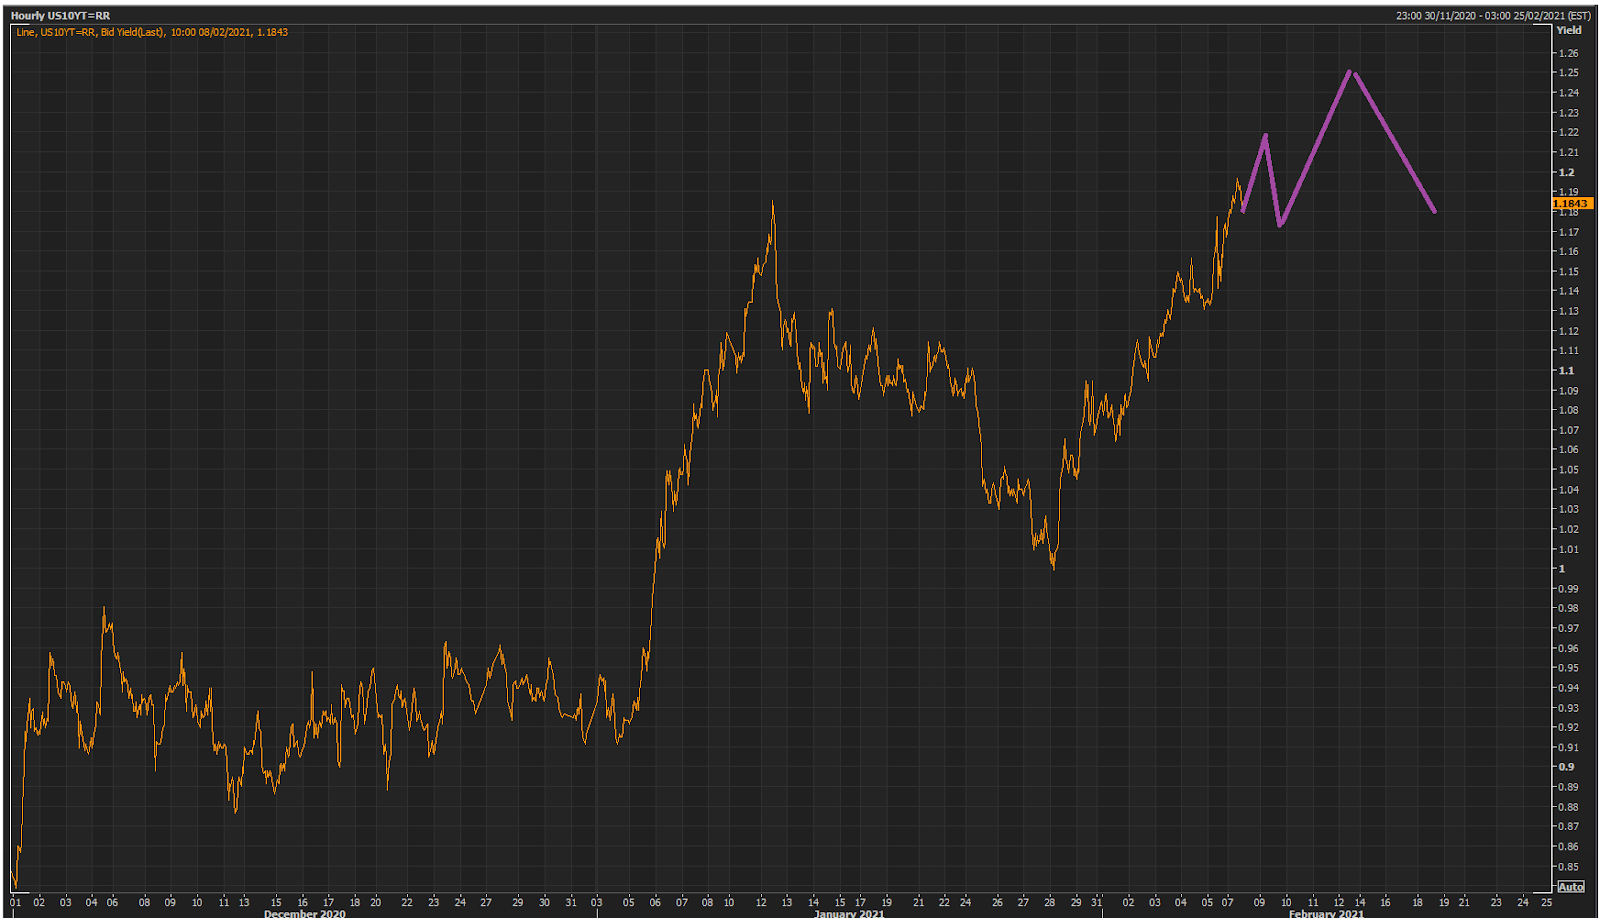
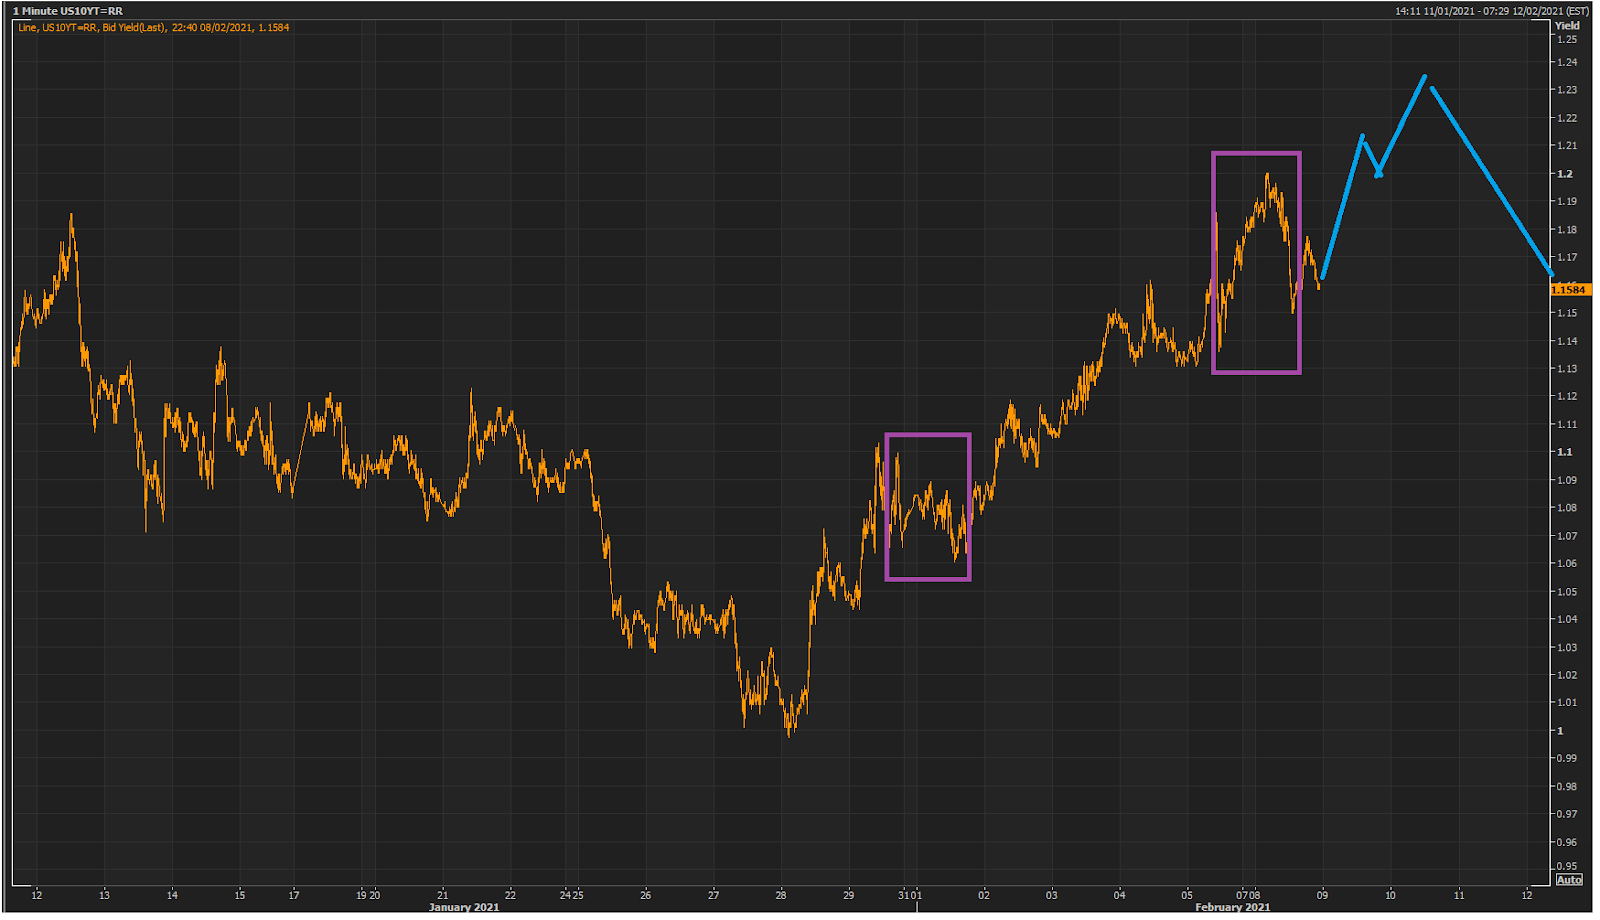
The Yield EWP looks like this -- so RTY should closely resemble the trajectory of the yield.
robert.p.balanModeratorLeaderOwnerFeb 8, 2021 5:24 PM
Yields pulling back -- it may eventually affect RTY, specifically.

robert.p.balanModeratorLeaderOwnerFeb 8, 2021 5:25 PM
*We will put a trail stop to the extra RTY long trade.*
all PAM EXITS THE LONG RTY TRADE BOUGHT AT 2213 (Feb 5) AT DOWNWARD BREACH OF 2255 OR AT 2290, LIMIT OR BETTER .. ALL FUNDS
robert.p.balanModeratorLeaderOwnerFeb 8, 2021 9:48 PM
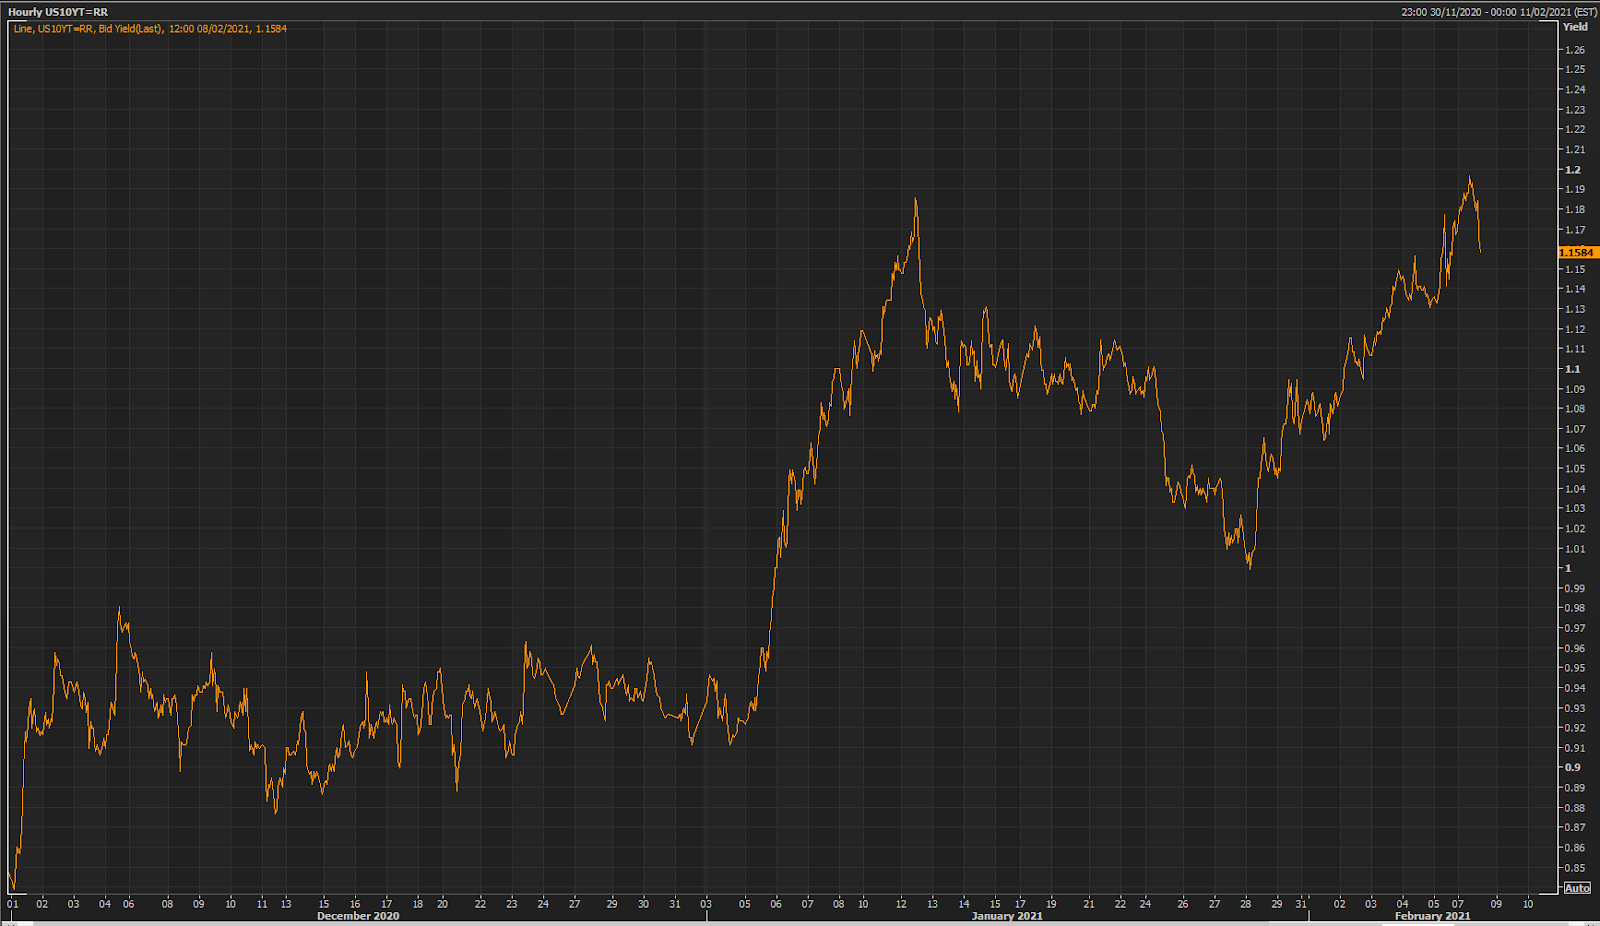
The Yield correction is probably over.
We need to remove the upside exit for the RTY long trade, just keep the lower sell threshold.PAM EXITS THE LONG RTY TRADE BOUGHT AT 2213 (Feb 5) AT DOWNWARD BREACH OF 2255 OR AT 2290, LIMIT OR BETTER
*Please modify to:*
all PAM EXITS THE LONG RTY TRADE BOUGHT AT 2213 (Feb 5) AT DOWNWARD BREACH OF 2255, GTC -- ALL FUNDS
robert.p.balanModeratorLeaderOwnerFeb 8, 2021 10:00 PM
all PAM BUYS ANOTHER 144 CONTRACT YMH1 AT BREACH OF 31255, GTC -- ALL FUNDS
robert.p.balanModeratorLeaderOwnerFeb 8, 2021 10:14 PM
PAM BUYS ANOTHER 144 CONTRACT YMH1 AT BREACH OF 31255, GTC
*This order was filled.*
*YMH1 -- DONE AT 31,258 BOUGHT ANOTHER 144 YMH1 SCALPERS, FOR ALL FUNDS.*
robert.p.balanModeratorLeaderOwnerFeb 8, 2021 10:20 PM
I will see you gals/guys in Asian trade. GN everyone.
FEBRUARY 9, 2021
GOOD MORNING ASIA / GOOD EVENING EAST COAST
robert.p.balanModeratorLeaderOwnerFeb 9, 2021 4:45 AM
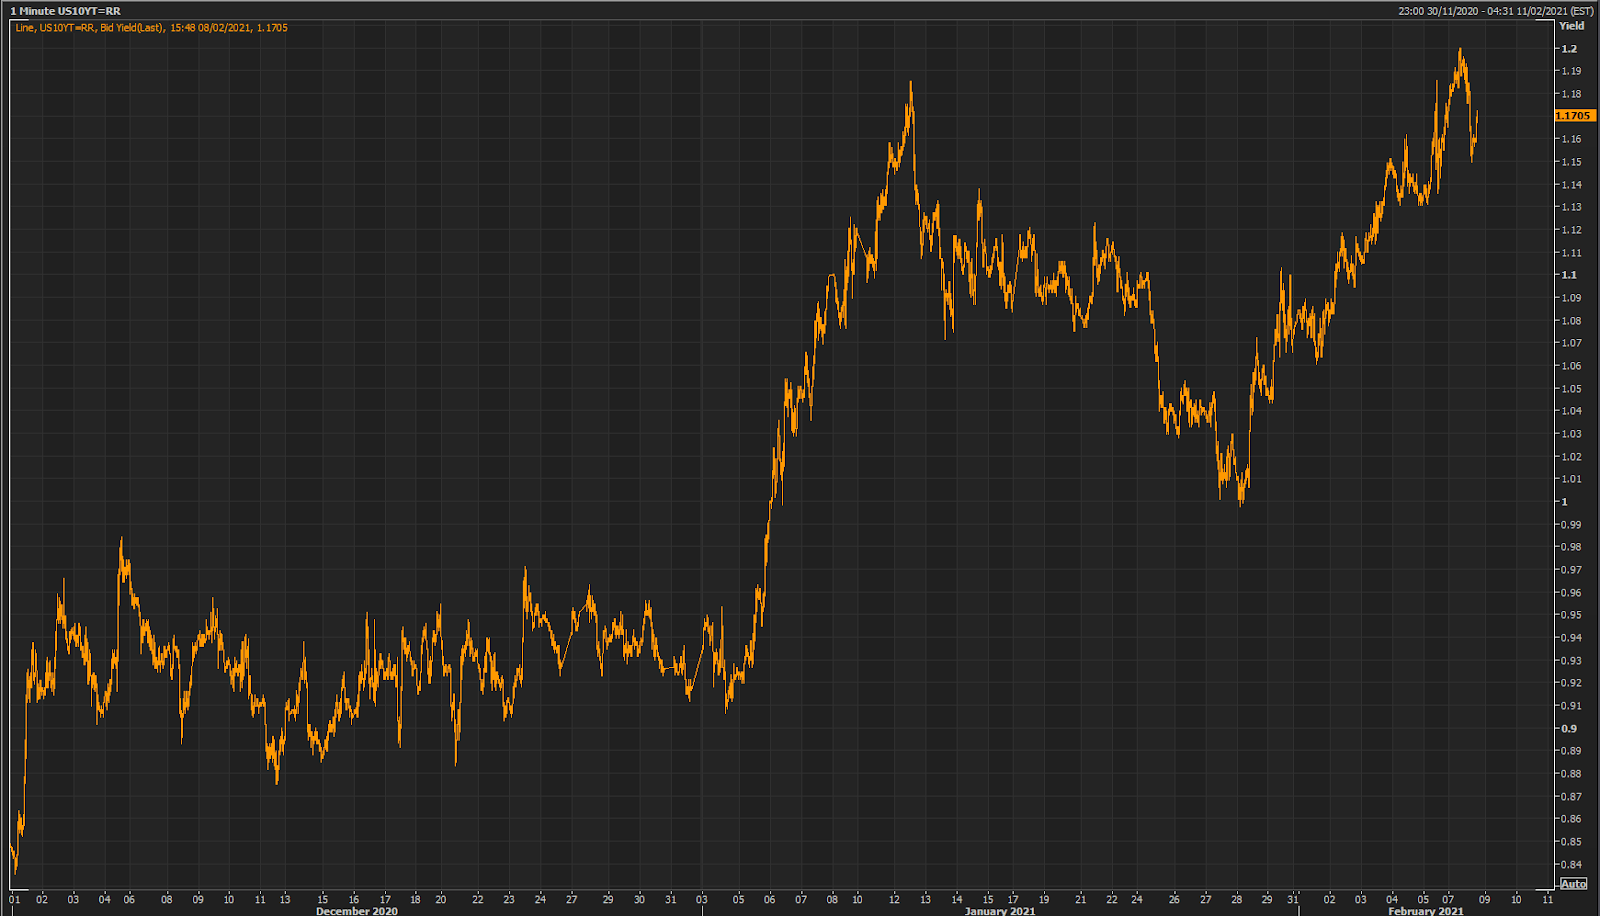
We are probably within two days from completion of the five-wave sequence in 10yr yield from the circa 1% trough on Jan 28.
That may mean we are also within two days of completing the equity rally from Jan 31. If we are to get the two day lag of equities to yields, that peak may be extended to take place three to four days longer.
robert.p.balanModeratorLeaderOwnerFeb 9, 2021 5:05 AM
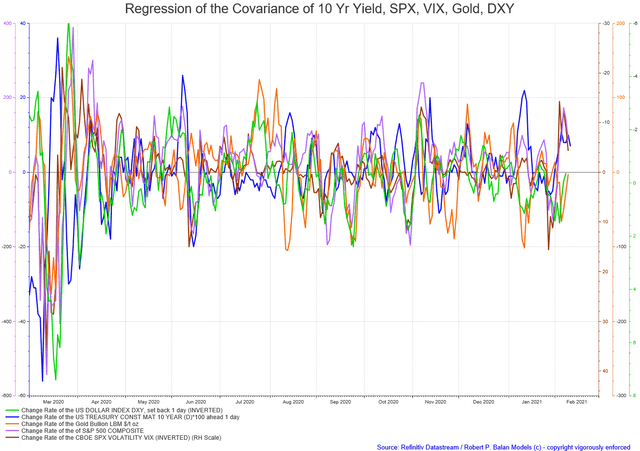
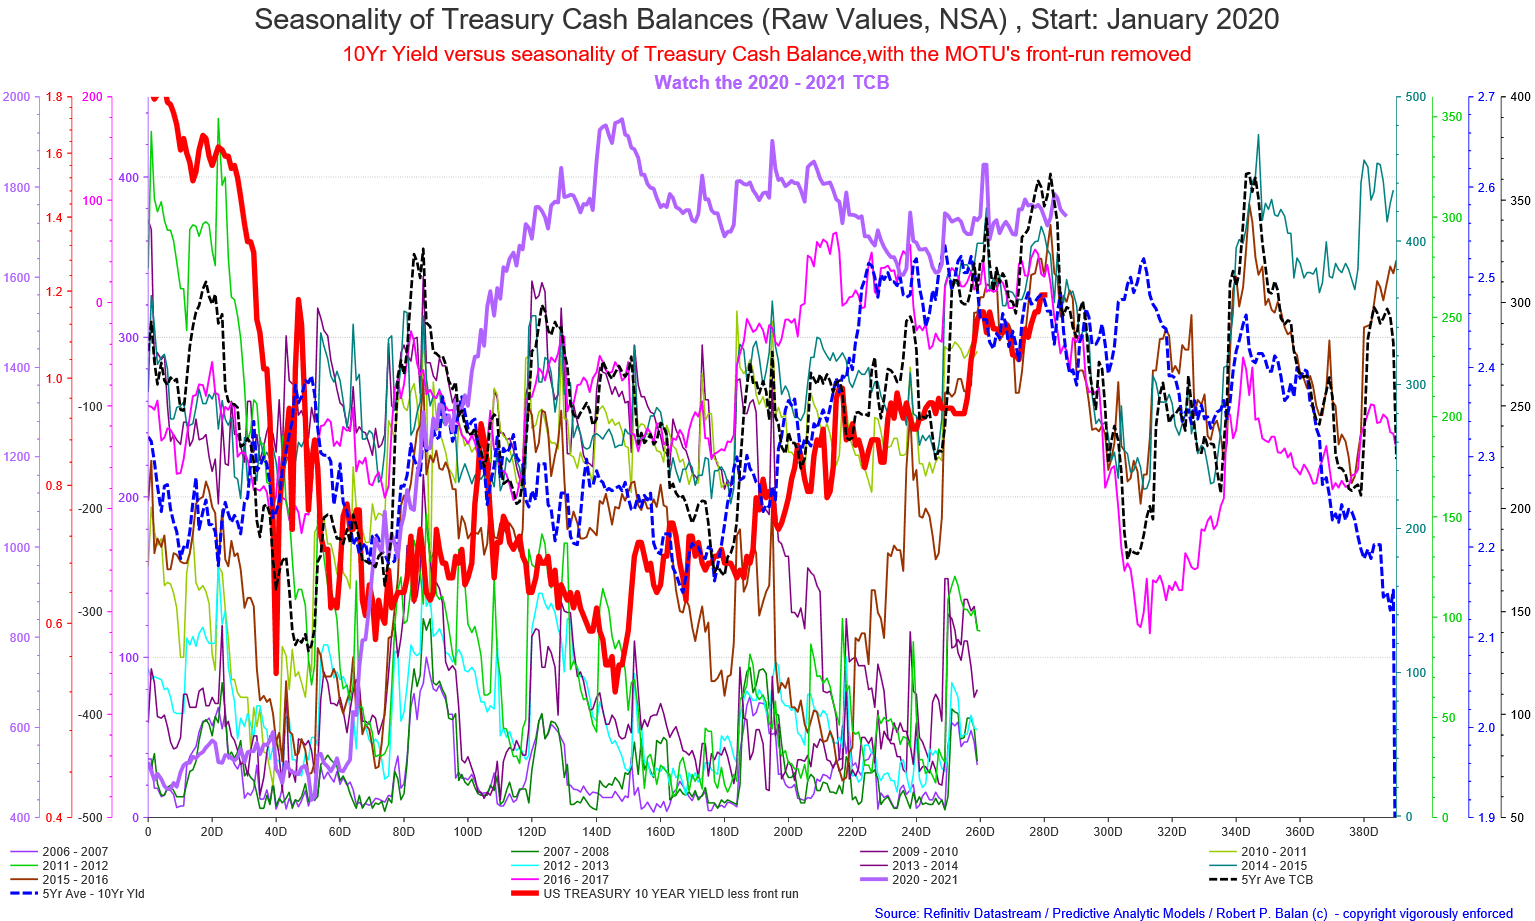
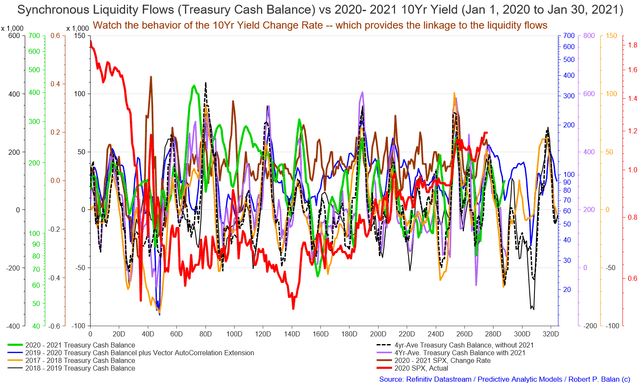
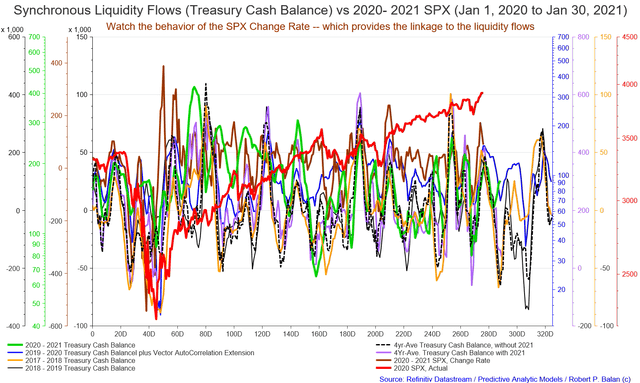
We have shown this chart before -- the lead effect of Treasury Cash Balance on the 10yr yield. We are also 2 to three days from a peak in yields, from this measure. The tell is further declines in the 2020-2021 TCB (purple line).
Even more significant to TimK and I was the behavior of the current (2020-2021) Feb Balance Sheet change rate -- individual 2021 year, or aggregated with the past 4 year performance. These change rates have been falling for two weeks.
Fed's Balance Sheet vs 10Yr Yield
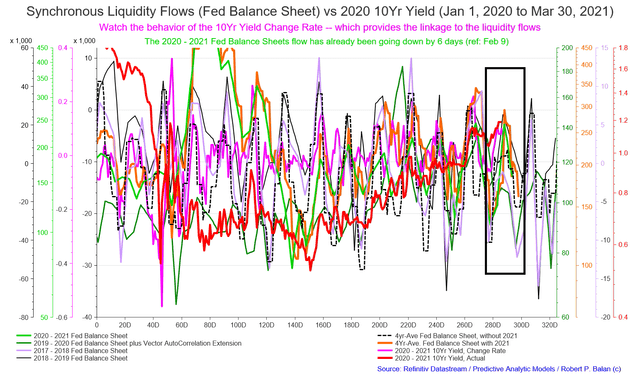
This suggest to us that we will probably see the peak inflection point of the 10yr's change rate in two days -- which happens to correspond nicely with the EWP projections.The seasonality of liquidity outflows (of the Fed Balance sheet) historically lasted 24 Trading Days from peak to bottom. That suggests circa 5 weeks of sideways to lower 10yr yields.
The same analytical template suggests similar performance for the SPX. Note the change rate of SPX (light blue line) which has already peak. Experience tells us that the nominal SPX should also peak with three days.
Fed's Balance Sheet vs SPX
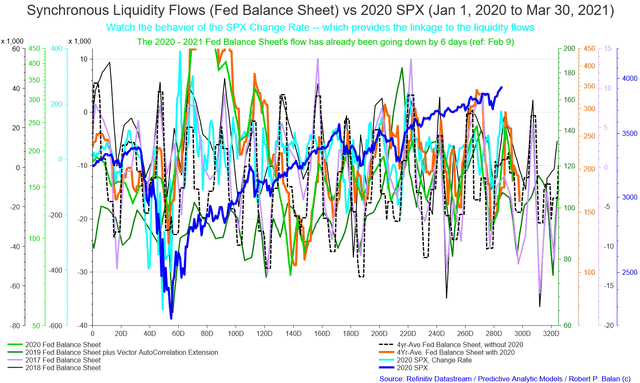
That dovetails nicely with the EWP projections shown at the beginning of the article.
We need more data to finetune the EWP of the indices. Probably by tomorrow NY open we would have enough to finetune a likely top -- when it may happen, and at what level.
See you at the Europe opening.
GOOD MORNING EUROPE / GOOD EVENING WEST COAST
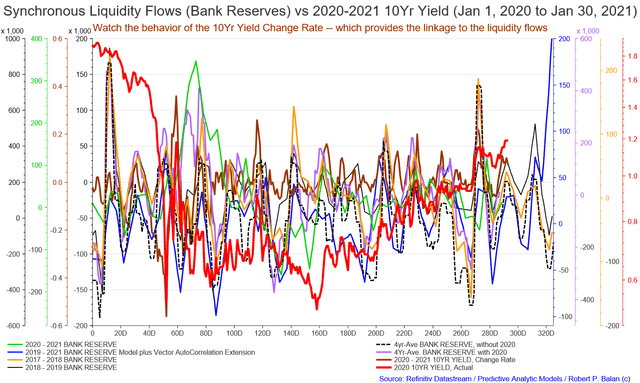
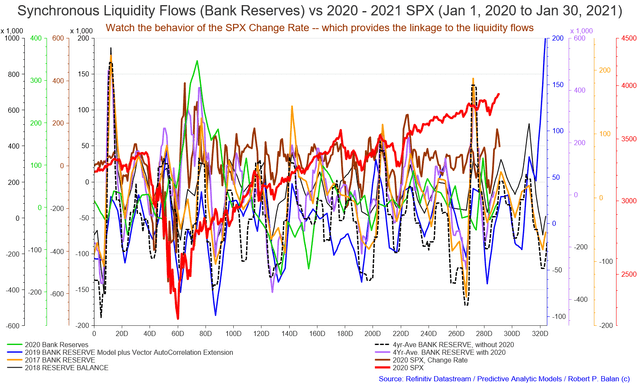
Mr. TK asked me to show how asset classes respond to the other systemic liquidity variables.
Here they are:
Bank Reserves vs 10Yr Yield
Bank Reserves vs SPX
Treasury Cash Balance vs 10Yr Yield
Treasury Cash Balance vs SPX
The bottom implied by the liquidity models for the yields (and probably for equities, as well) ranges from 24 to 29 Trading Days from today (Tuesday, February 9).
robert.p.balanModeratorLeaderOwnerFeb 9, 2021 1:48 PM
The Bossman has given us the signal to start trading ETFs at the ALGO Portfolio starting today.
He also said that the One-Contract Portfolio (now called "The Eiger Fund" -- named after an Alps peak in Grindelwald, where he was born) -- is now live.
We will maintain the One-Contract Portfolio (Swing Portfolio tracker) in parallel with the Eiger Fund for a while -- until the new fund spreadsheet gets populated with trades.
I will write an article tonight providing details of these new activities.
vjapnFeb 9, 2021 2:13 PM
Robert, Due to MOTUs front running and the variable of how many days they front run, could yields have already peaked?
robert.p.balanModeratorLeaderOwnerFeb 9, 2021 2:21 PM
The MOTU's frontrun -- which period is not the same for all asset classes -- was taken out in the models. This variability is suspected by Mt. TK as the reason why changes in equities lag behind changes in long term yield during crucial inflection points. The MOTUs, as you know, are the Fed's Primary Dealers (plus some hangers-on Hedge Funds and non-PD investment banks). The MOTUs understand the bond market very well (and its signaling effect on markets) and they often set-up hapless retail equity investors by bidding equities higher before hammering stocks lower.
Watch these variables carefully (see chart below):
PD Transactions Gov't, PD Transactions Treasuries 7-11 Yr, PD positioning Gov't
Transactions in government paper/long duration now falling, as PDs start increasing position in gov't paper
If the PDs start hoarding gov't paper in earnest, it's time to bail out of short bond positioning.
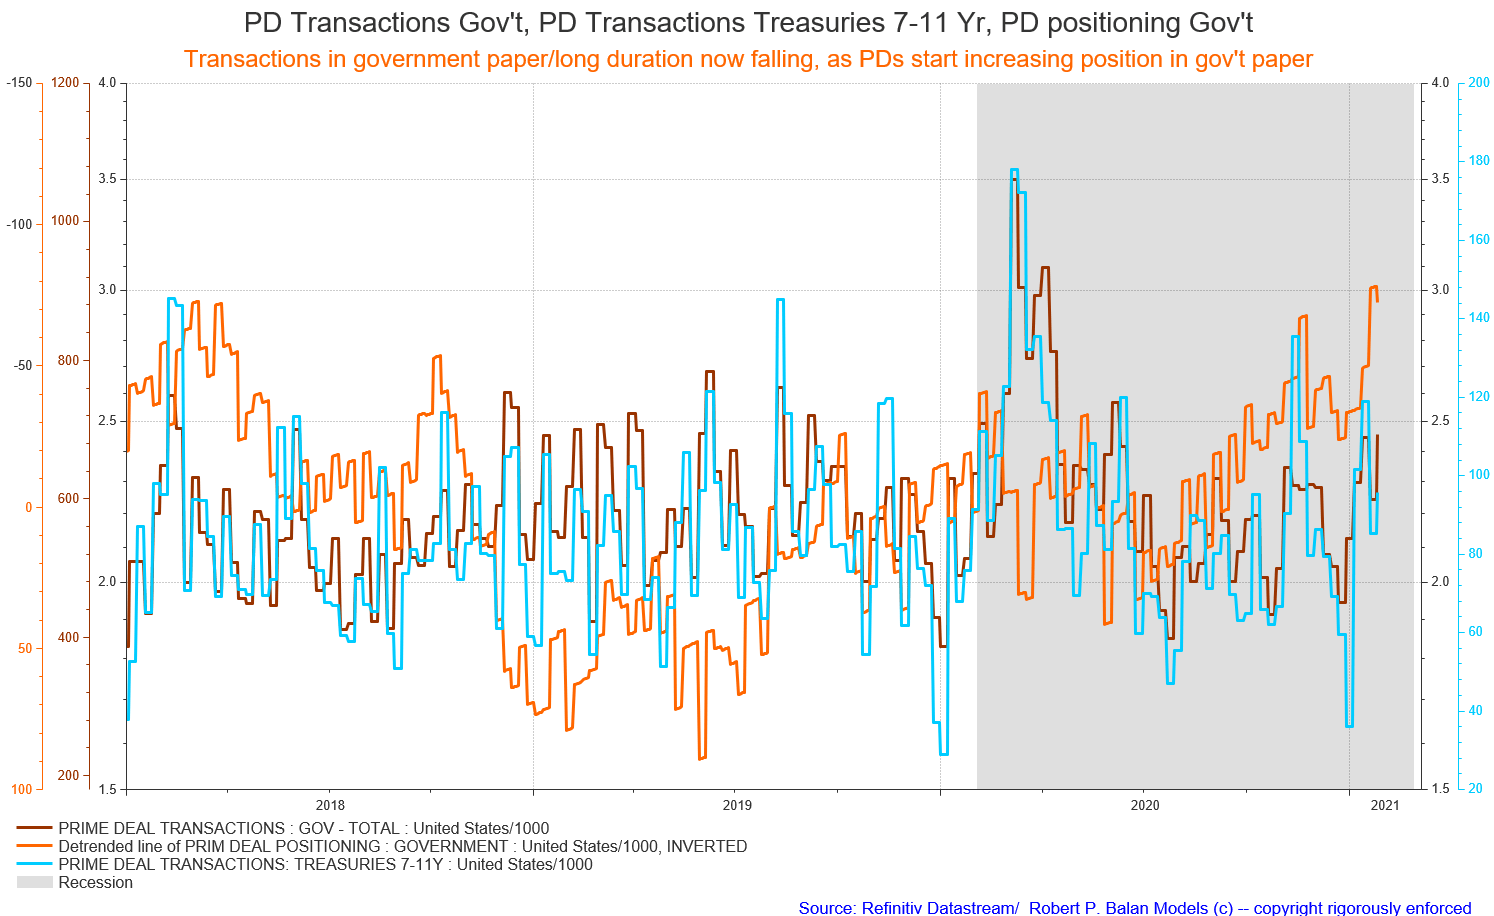
(To be updated after NY close today, Tuesday, February 9, 2021).

Thanks.