


Original article here:
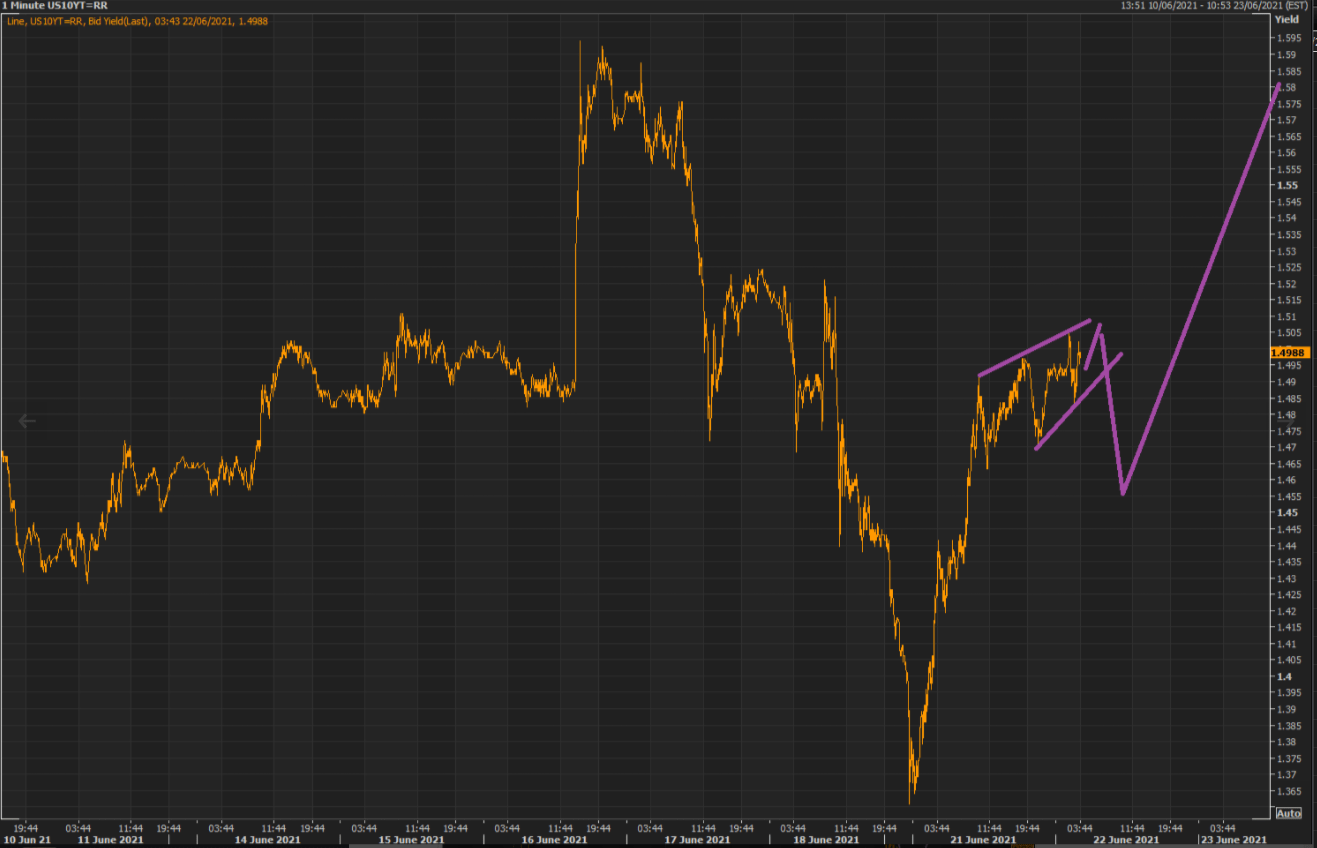
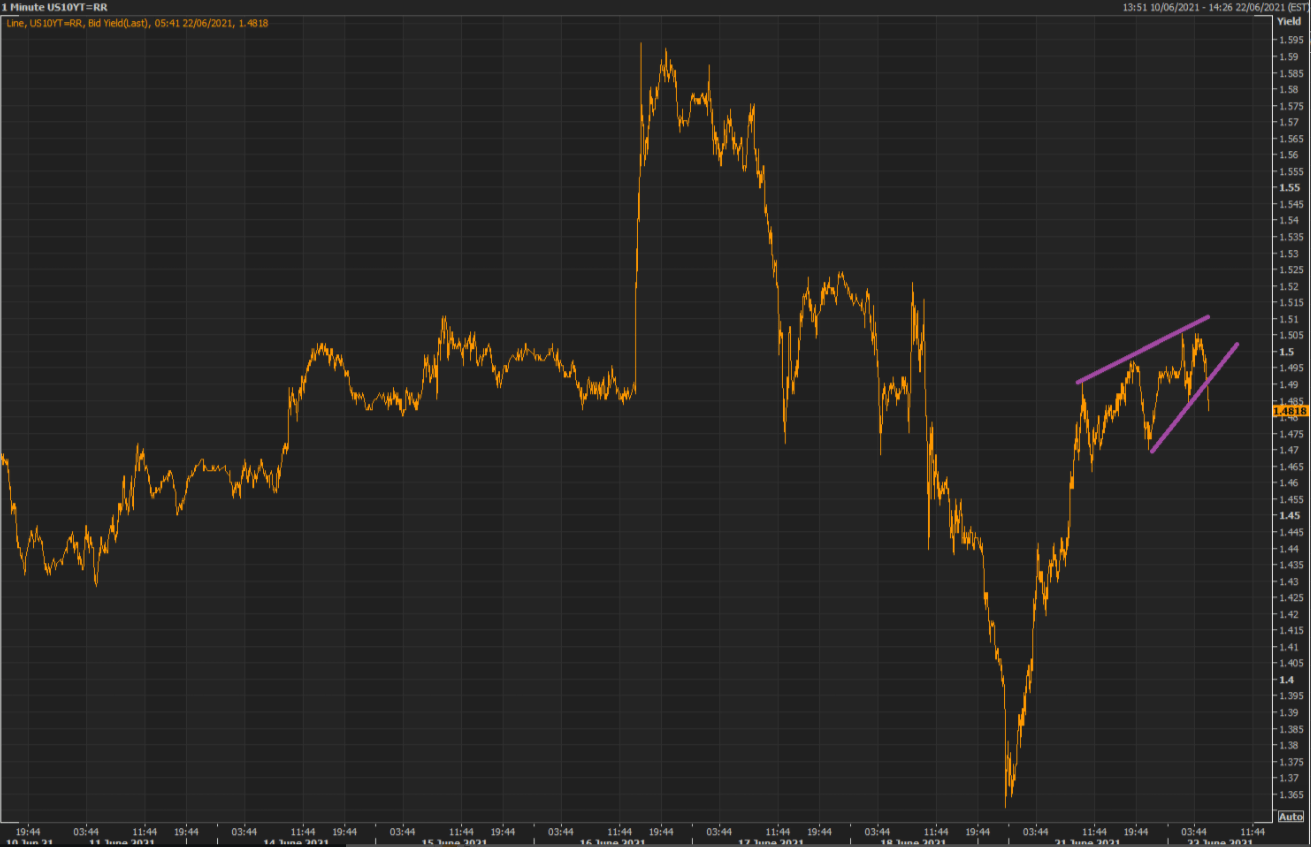
The minor topping out process in the 10yr yield became more complex unexpectedly, but does not change the outlook of a yield pullback before it goes towards the high 1.50s again. We still expect a pullback BEFORE more significant gains for yields, upside.
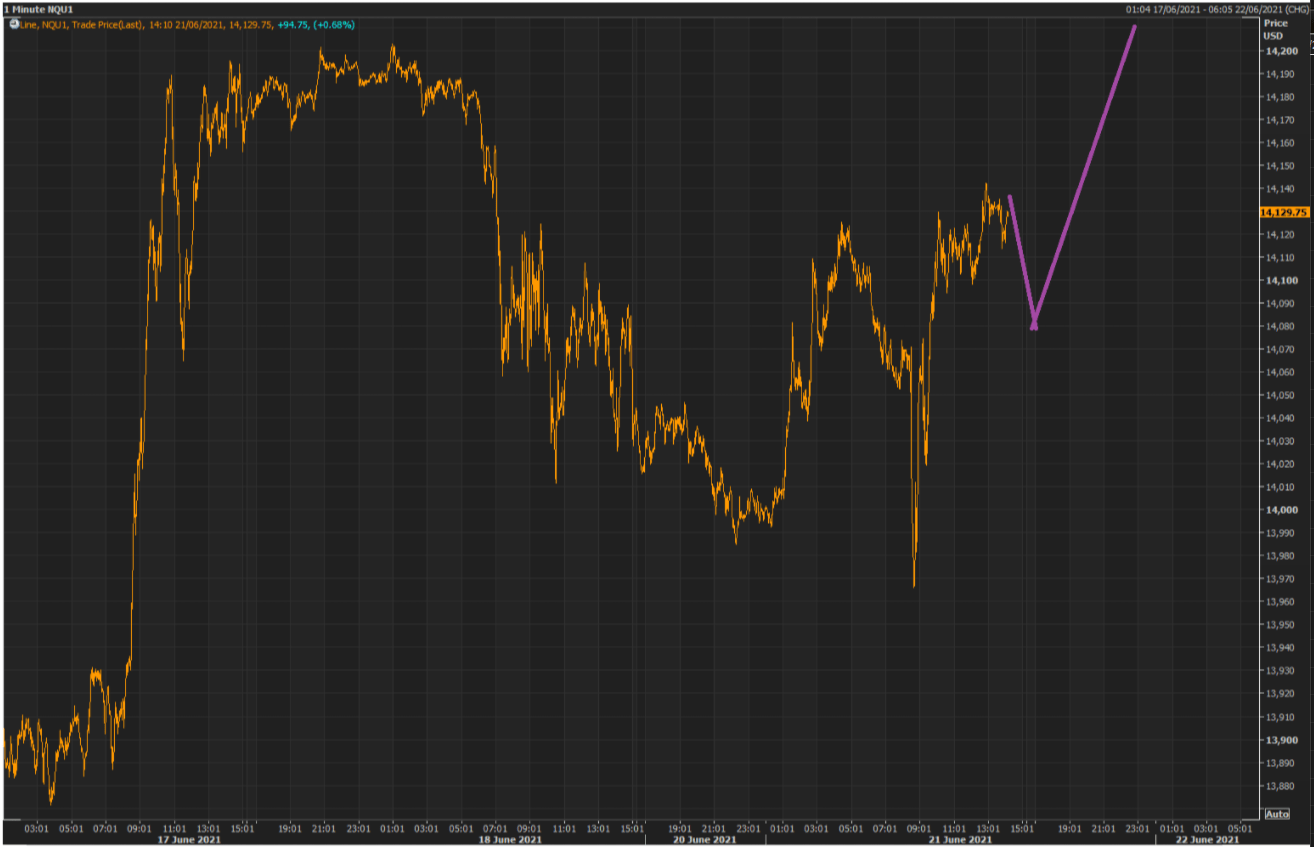
So this minor excursion of the yield from paths drawn, will not change the topology of this earlier NQ illustration (below), which was looking for terminus of the last minor down phase a circa 14,090/80. -- then ratchets higher, as the yield pulls back after completing the small wedge top structure
It is becoming clear that the ES may resolve into a five-sequence (which should be consistent with the NQ outlook). The penultimate stage (the four, second green box) is almost done. I am sure the onset, and travel, of the five will be illustrated in detail by Beam when she gets a chance.
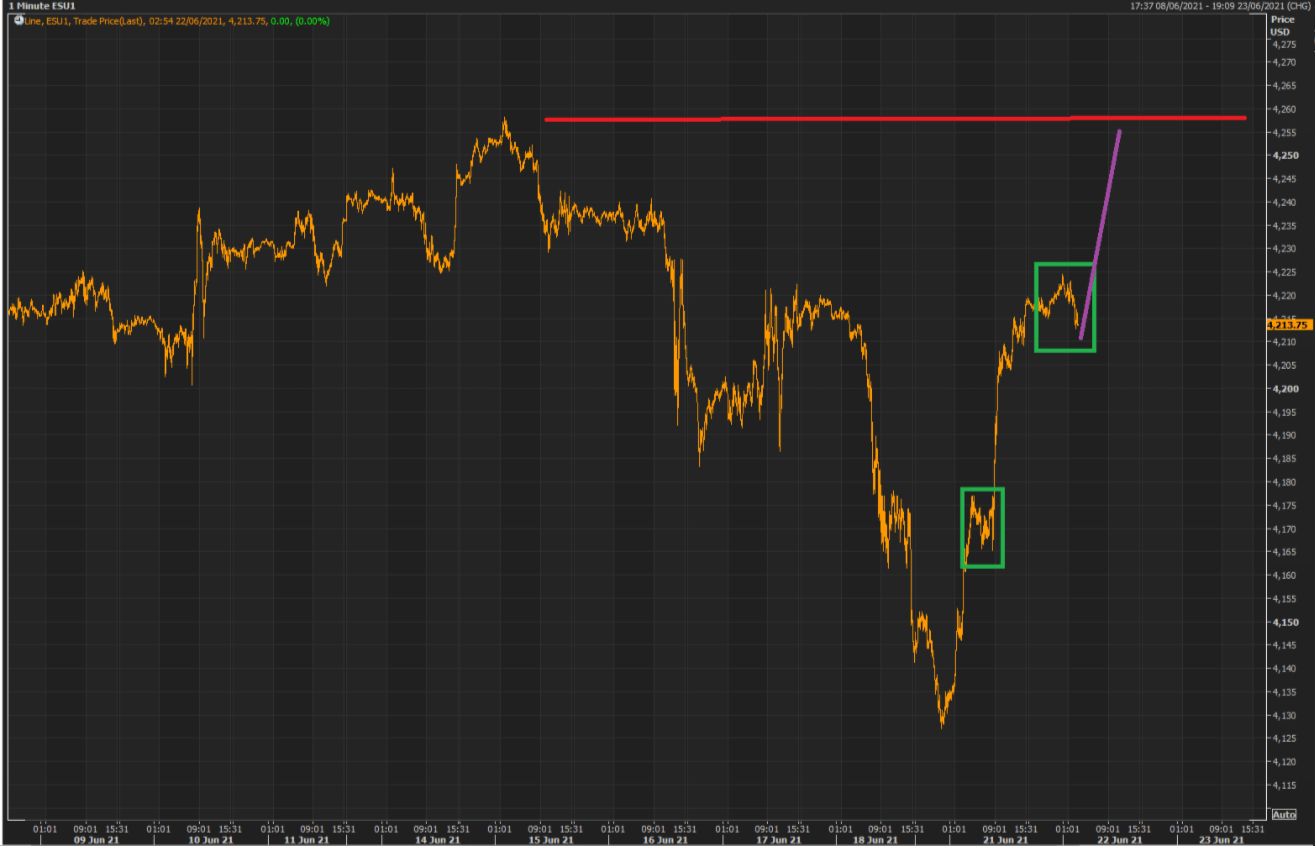
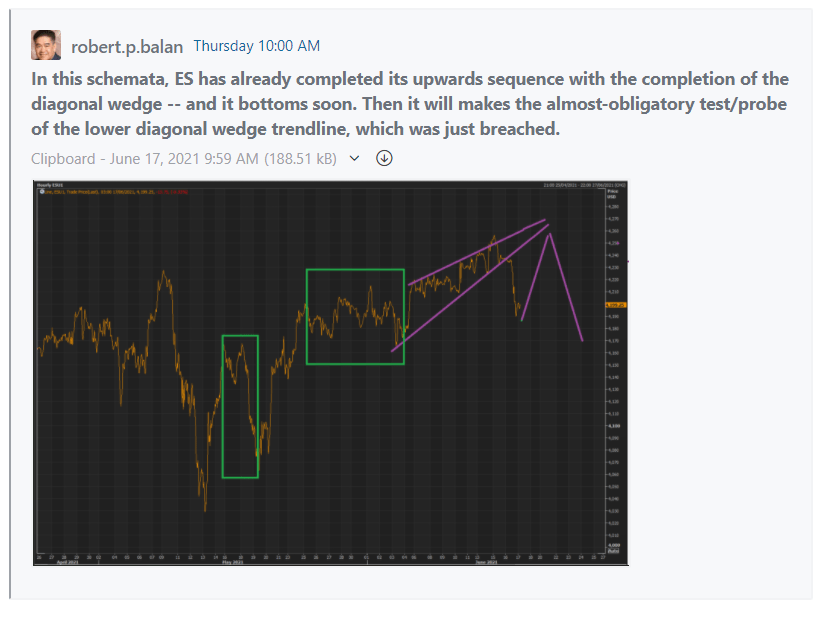
This further upswing we expect of the ES, should put paid to the scenario we put out on June 17, just after the diagonal wedge was breached to the downside.
I tell you, it pays to take a hard look at what pattern analysis has to offer. Patterns put traders' sentiment in graphics -- and human behavior is nothing but consistent. Anyone who scoffs at those graphics (the now discredited "random walkers" especially) does not trade, or trades badly.
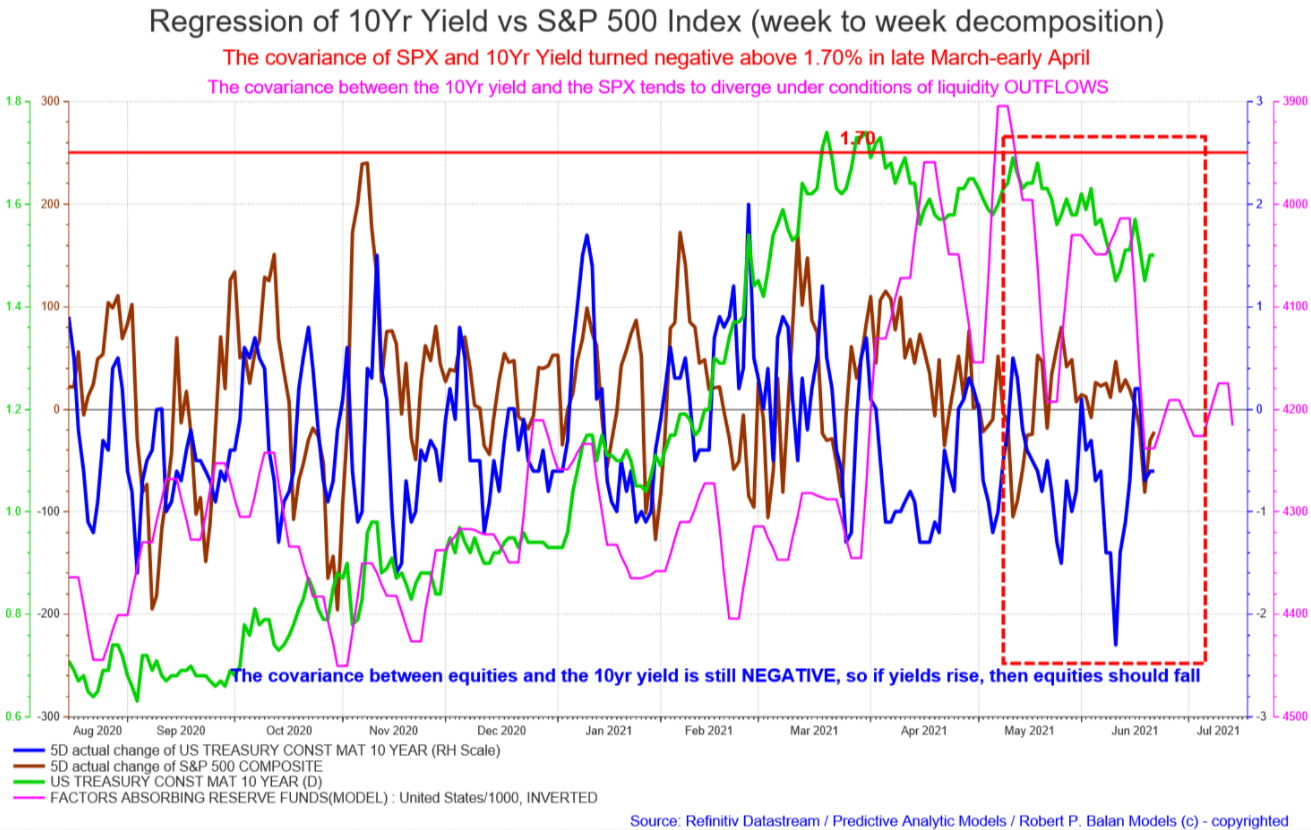
Once again, the covariance between the 10yr yield and the SPX has gone positive. For how long this will last, we don't know. However, there is empirical evidence, which suggests the this divergence occurs during phase of intense liquidity outflows, pink line, inverted, below). With liquidity flows stable short-term, we can expect the positive covariance to hold.
Therefore if long-term Bond Yields are rising, then SPX (as proxy for the stock market) MUST be ascendant as well.
And if bond yields fall, then SPX et al., must fall, as well. Remember this well -- because we still expect long bond yields to fall until late July, even early August.
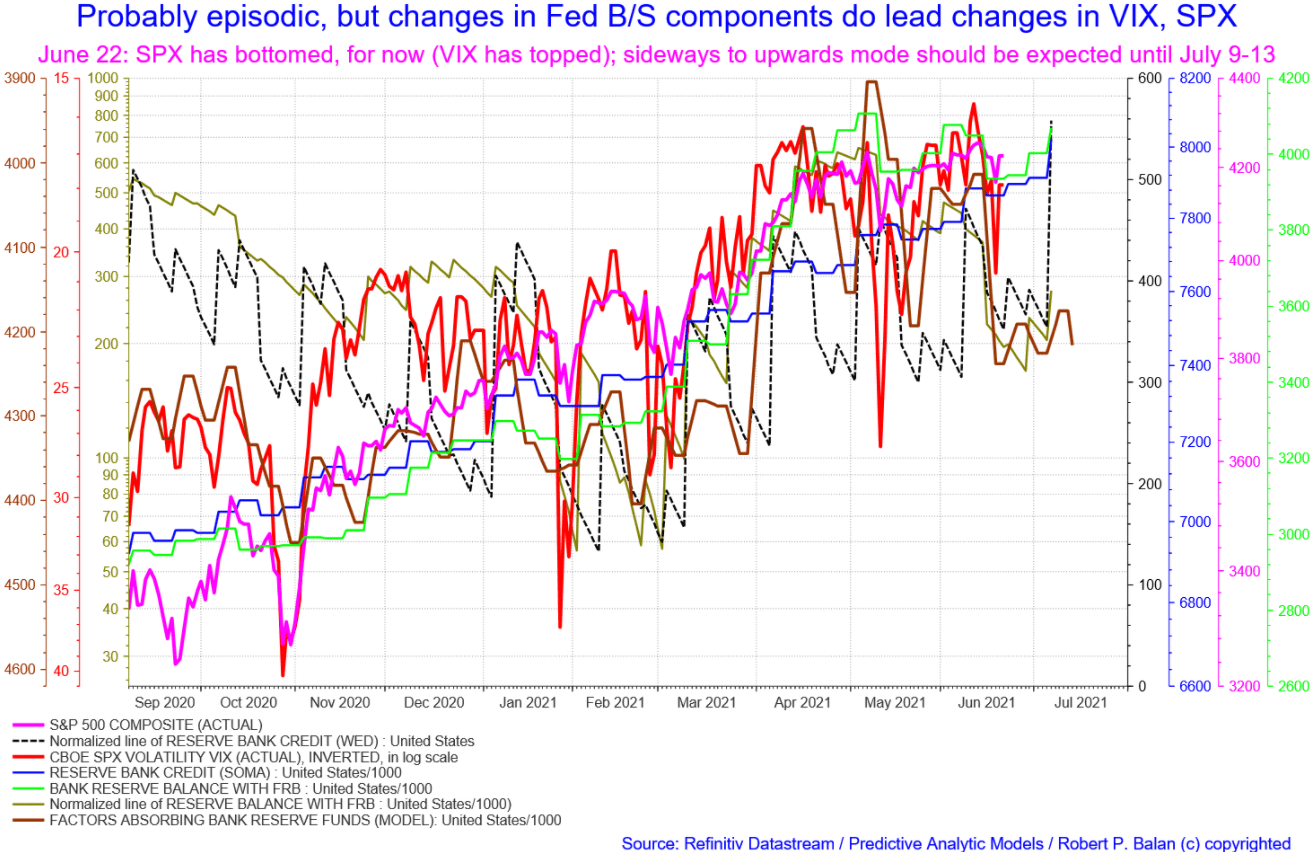
This liquidity model (below) illustrates and affirms that covariance as well.
June 22: SPX has bottomed, for now (VIX has topped); sideways to upwards mode should be expected until July 9-13.
This postpones the Apocalypse that linear (ruler and pen) technical analysts have been proudly broadcasting at TWTR, until yesterday, that is -- when the markets regained all that have been lost the previous day (plus a little more). THAT was not part of their narrative of a straight Highway To Hell.
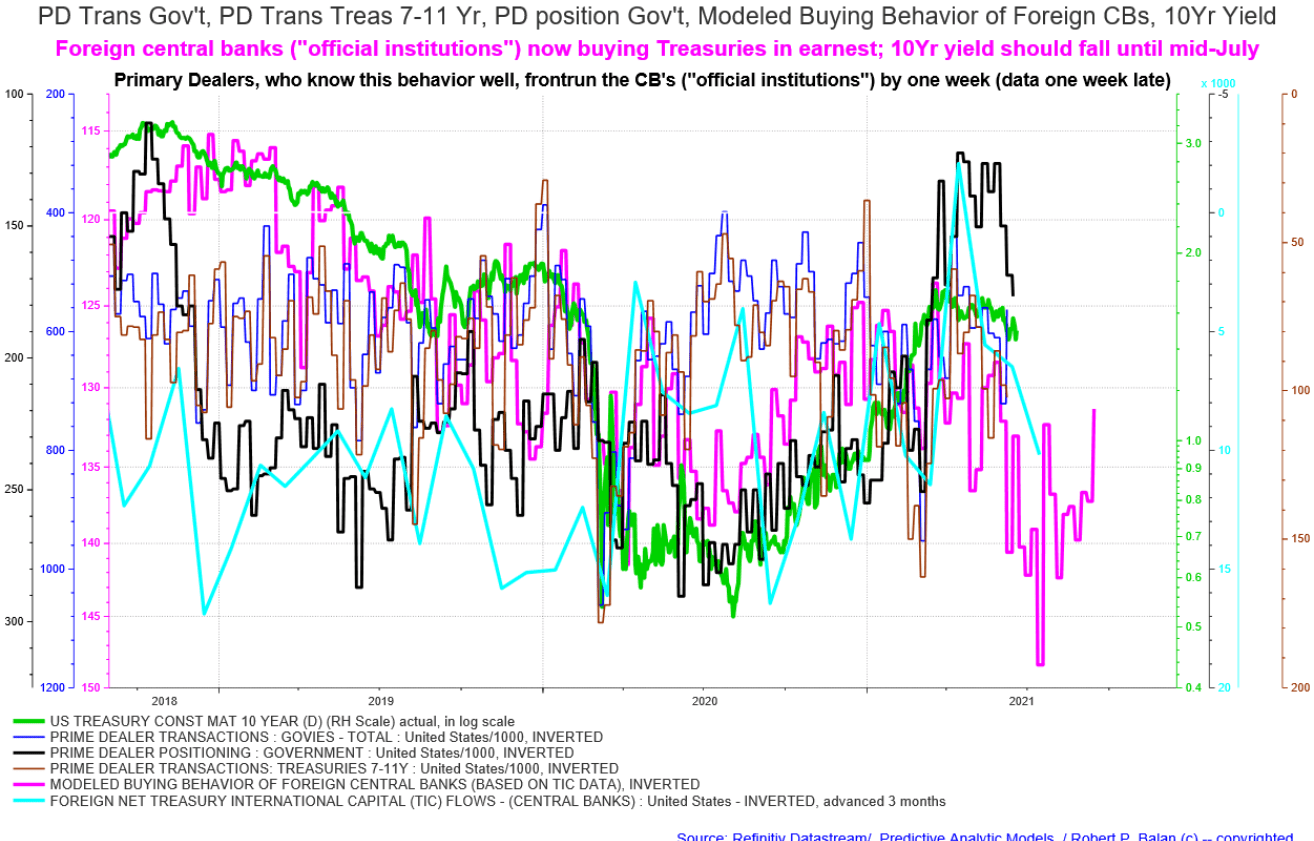
The Primary Dealers are all-in long bonds (black line).
But in retrospect, the global central banks are a lot smarter than anyone (light blue line). True, they tend to be a little early (one quarter too early), but if one understands their reaction function (we at PAM do, MOTUs do as well), you can do trades taking advantage of this knowledge, while awaiting the chance to pull off the bigger game.
I have been watching these players for more than 30 years, and even modeled their typical behavior in acquiring US securities (pink line). If we got it right this year, their purchases peaked three months ago, as reckoned as from July. Yields should be lower until 4th week of July. Moreover, the model is just a model -- yields can fall until early August.
While their covariance can again diverge -- a sustained decline in yields cannot be ignored by the stock market -- SPX will follow the 10Yr yield lower, even if that process lags for a while.
GALS/GUYS --MAKE SURE YOUR LONG NQ AND LONG ES TRADES ARE ON . . .
The yield's five-sequence is complete -- the 10 yr yield now on full correction mode. The more the yield corrects lower, the more NQ and ES will rise. Good luck!
------------------------------------------------------------------------------------
This is the latest performance of PAM's One-Contract Portfolio, with a margin capital of $100,000, making the same trades as the flagship Swing Fund, but doing consistent, one contract-trades.
----------------------------------------------------------------------------------------
Here is the current status of the PAM flagship Swing Fund, which includes open and closed trades.
During the first five months of 2021, PAM delivered phenomenal real-dollar Hedge Fund trading performance, the best at Seeking Alpha:
PAM's flagship Swing Portfolio, year-to-date (May 30, 2021) delivered $97, 370,488.48 net profit on $11,172,813 margin capital.
Year-to-date performance: 830.23%.
........
