


JULY 2, 2021 EUROPE OPEN BRIEF:
I had an interesting convo with RM13, PAM's options specialist, few days ago, about 40,000 SPX calls expiring Friday. Making long convo short, here's snag of that convo:
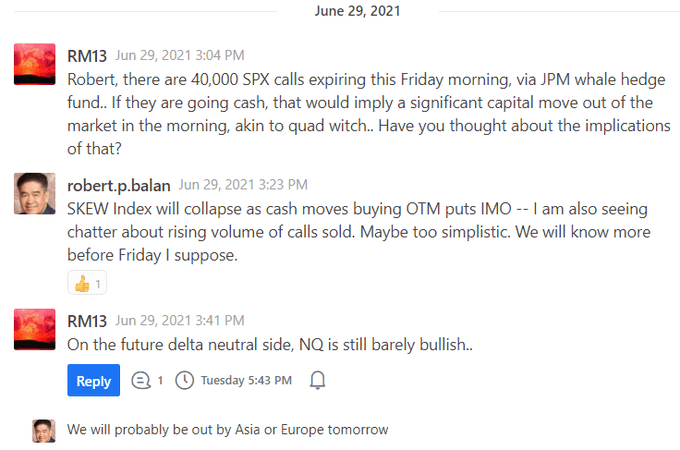
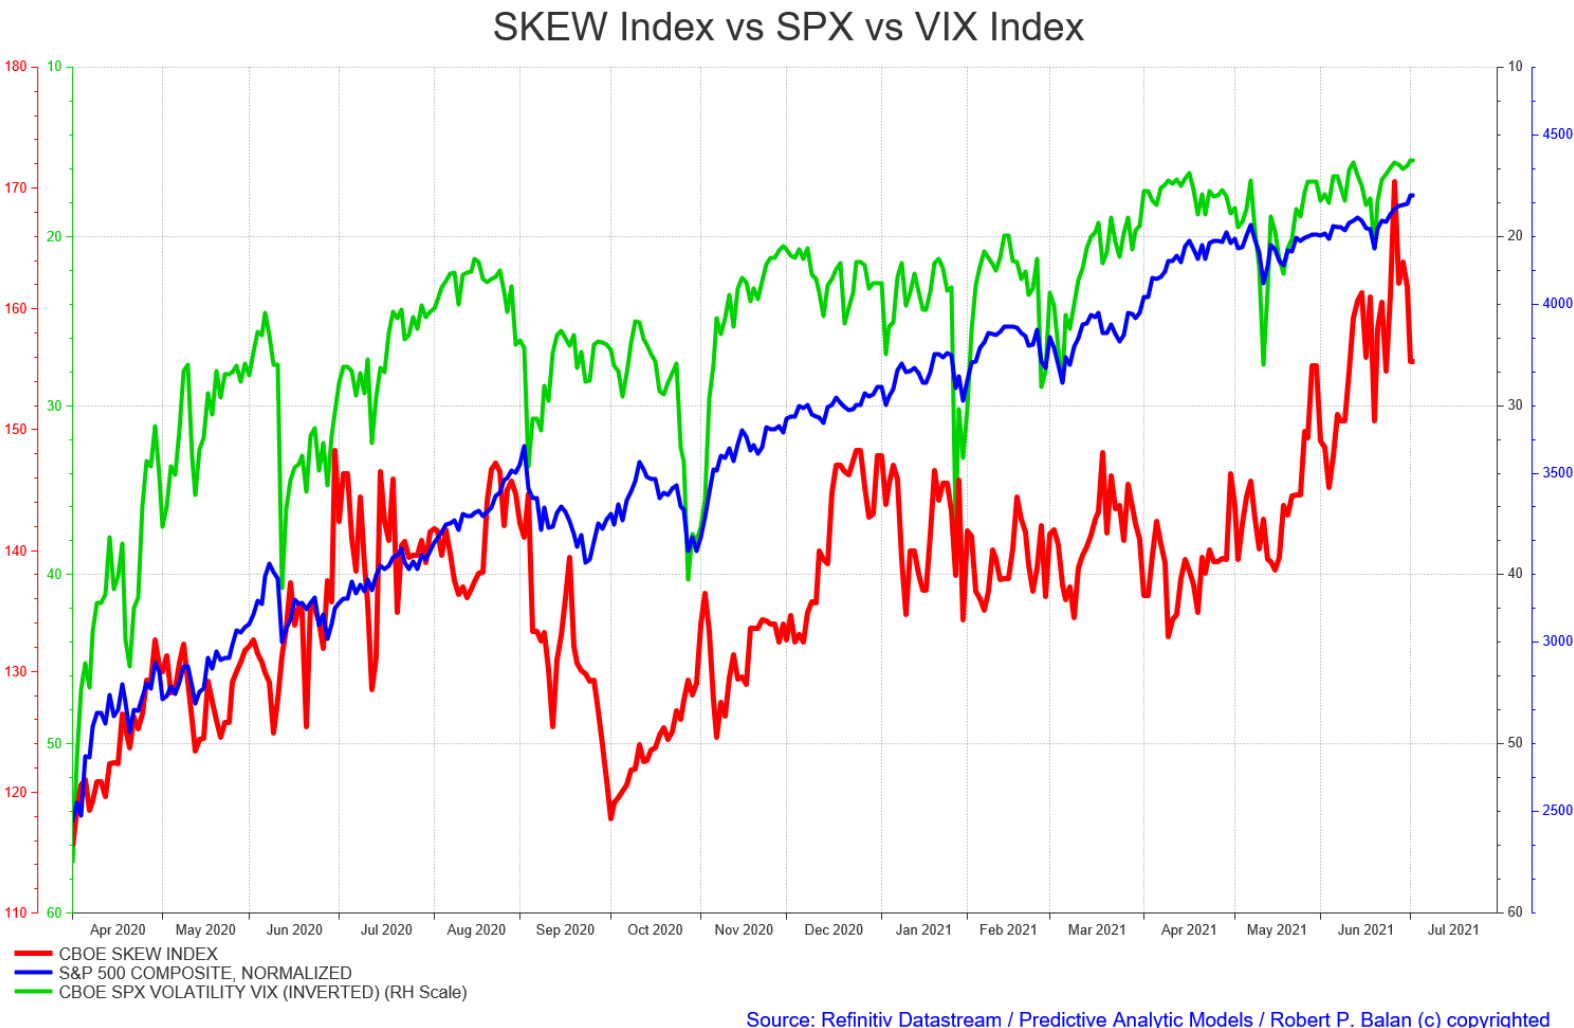
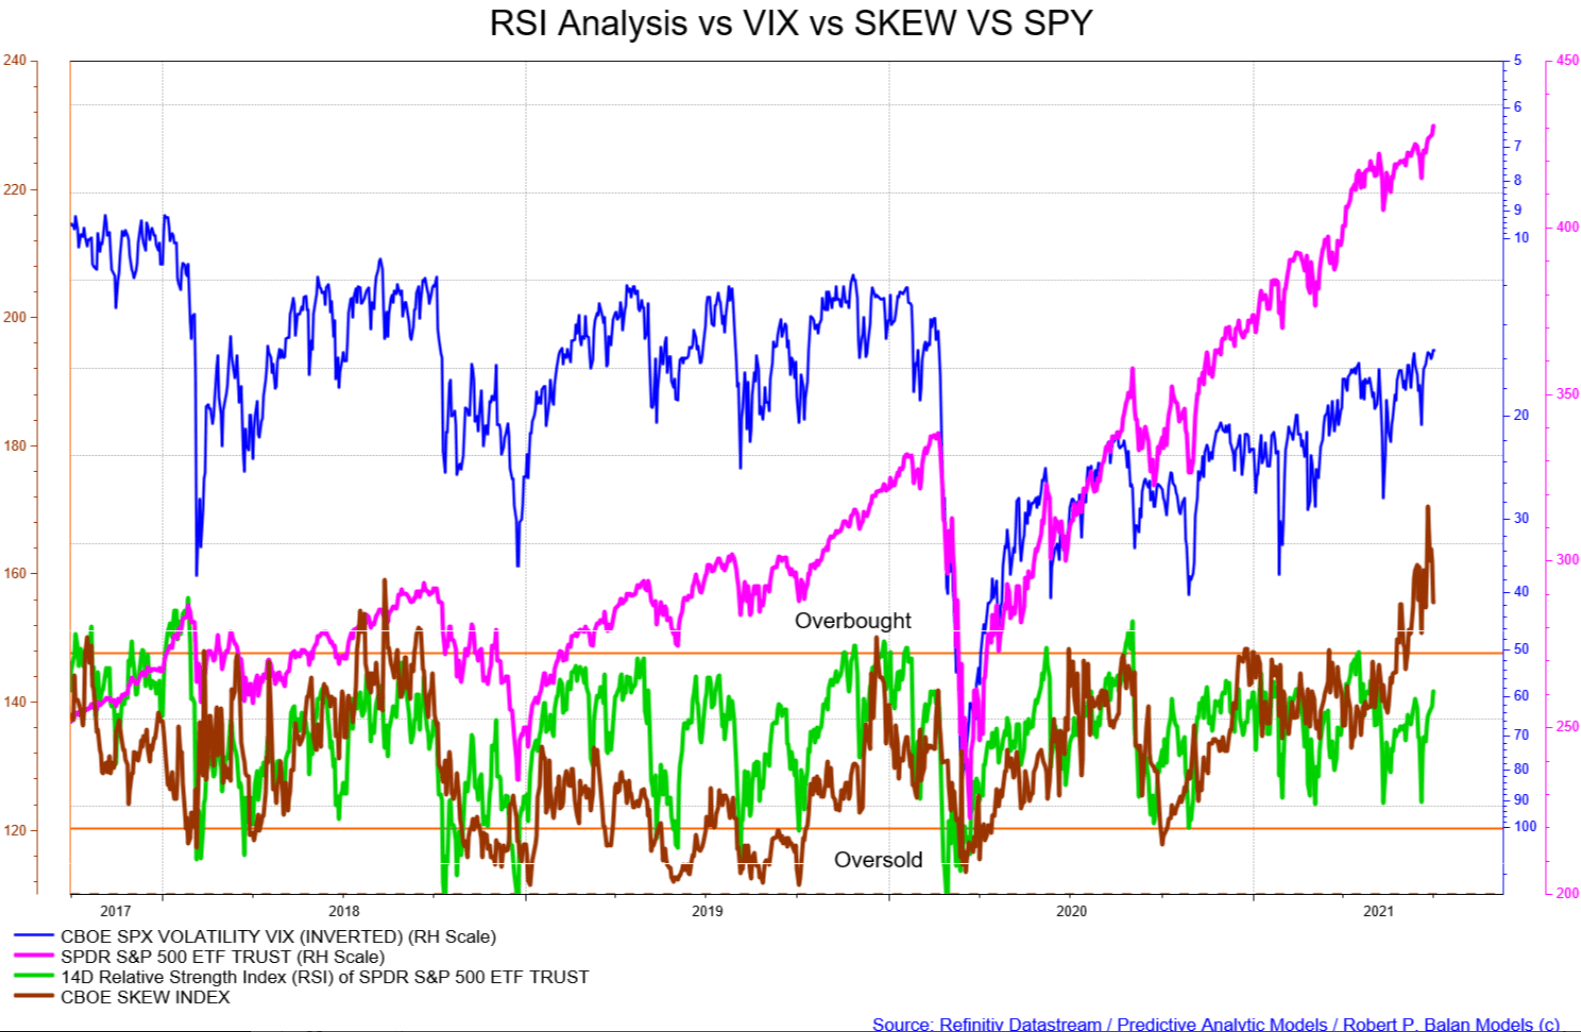
Indeed, the SKEW Index has been collapsing for the past 4 trading days, while the VIX has fallen, and the SPX continues to be biased higher.
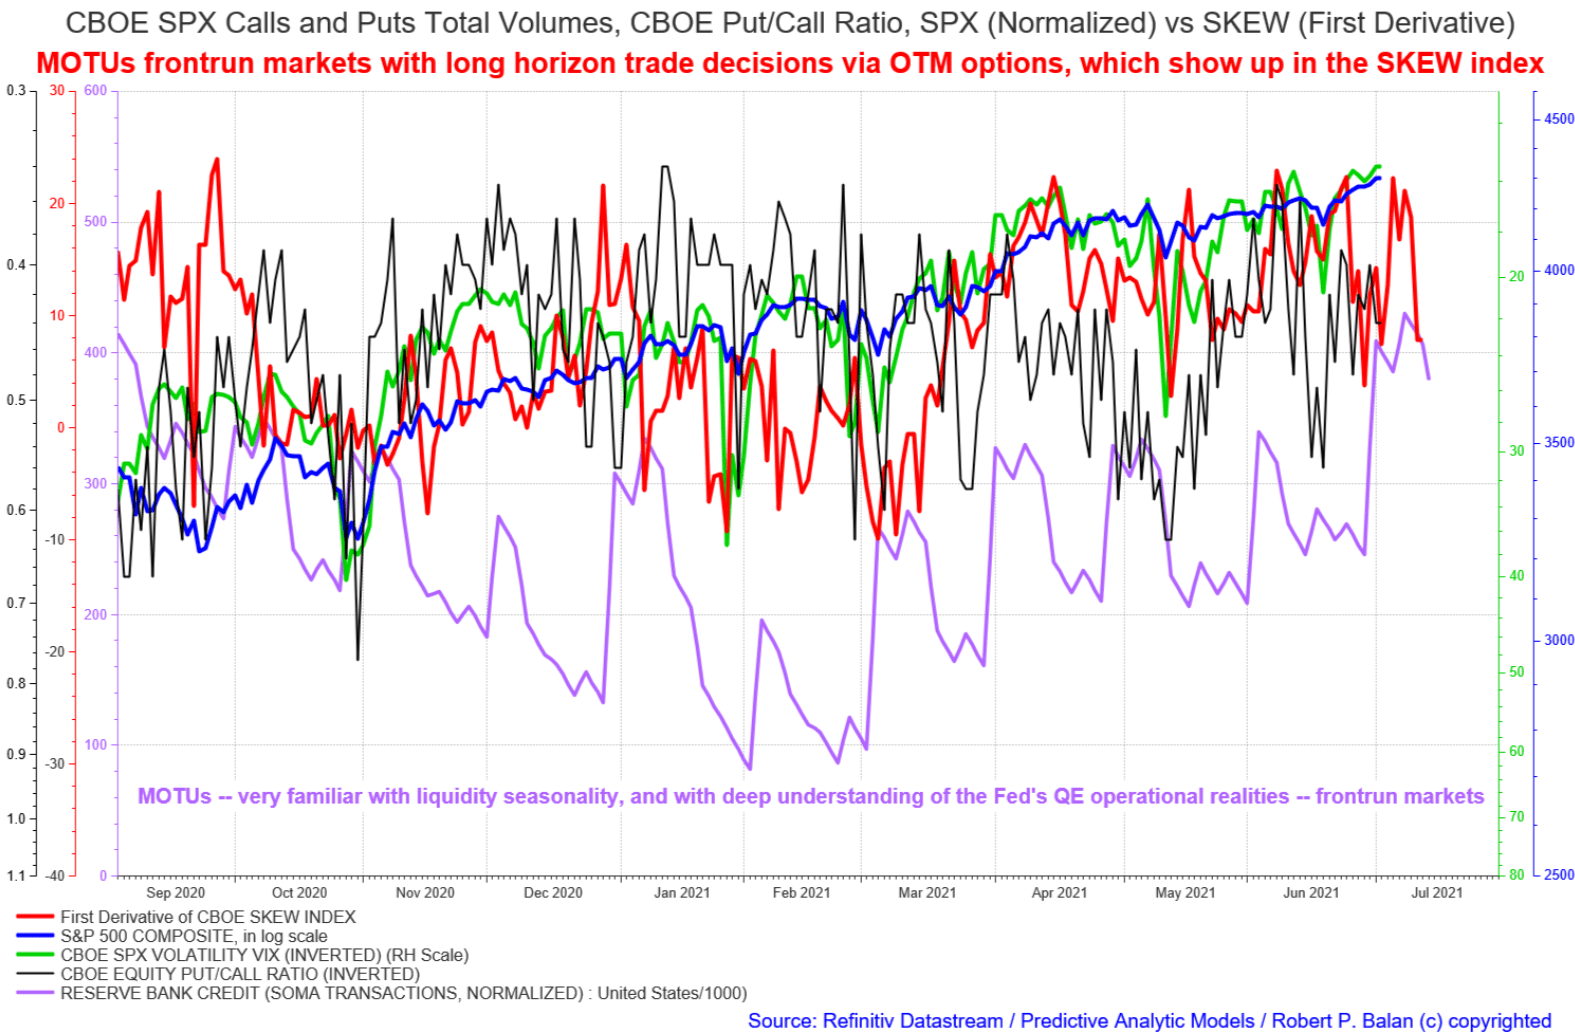
RM13 Rafa's input about NQ Delta Neutral's near term state was also one reason why we offloaded our long NQ trades, and started looking at the NQ short side. For me, liquidity flows have aligned with some Optionality conditions (see chart below), which was more than enough reason for Tim and I to offload NQ long -- and probe the NQ downside.
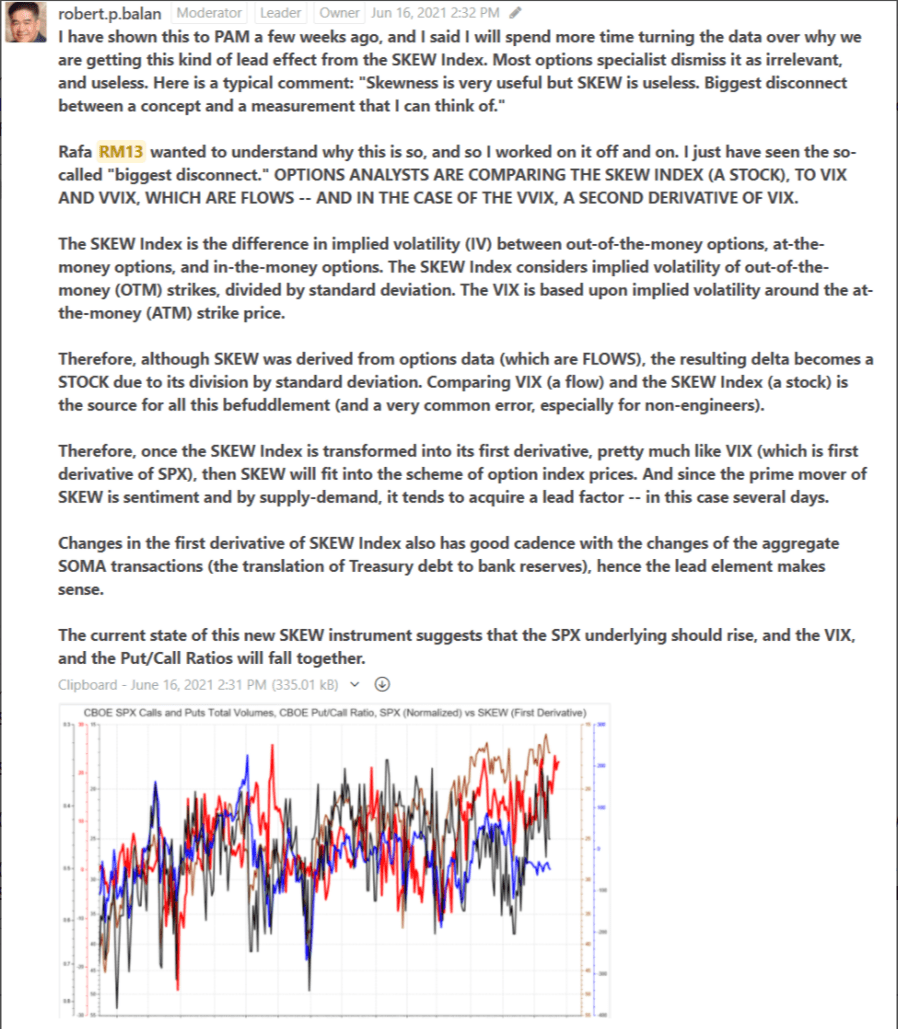
I explained the mechanics of how PAM uses the first derivative of the SKEW Index as a leading sentiment indicator, when used in conjunction with liquidity flows. Here is the June 16 post which dissected the procedure.
So why are we putting this at the forefront today?*
*Several reasons:*
*(1). The expiration of the calls that Rafa has highlighted. I really believe that money goes OTM -- which is maybe now showing up in the SKEW Index.*
*(2). Guided by the research work of* bogeygolf *I added the SKEW Index to PAM's RSI construct, and got some startling results -- when scaled properly, the SKEW Index also becomes a Relative Strength Index indicator, and if used this way, the SKEW Index is currently a future five-alarm fire.
Here is a summary of what Goldman says about the high level of the SKEW Index.*
*Putting it all together, Goldman summarizes that the current level of skew reflects views that:*
*1. should the market sell off, it would do so in a volatile way;*
*2. there is unfavorable asymmetry in potential returns; and*
*3. stocks would become increasingly correlated with each other in a sell-off.*
*In short, "high recent volatility-spot beta and an elevated VVIX (vol-of-VIX) index both support the potential for a return to high volatility in a sell-off" or in other words, stocks may be at a record high, but they have also never been more fragile and more sensitive to even a modest drop.
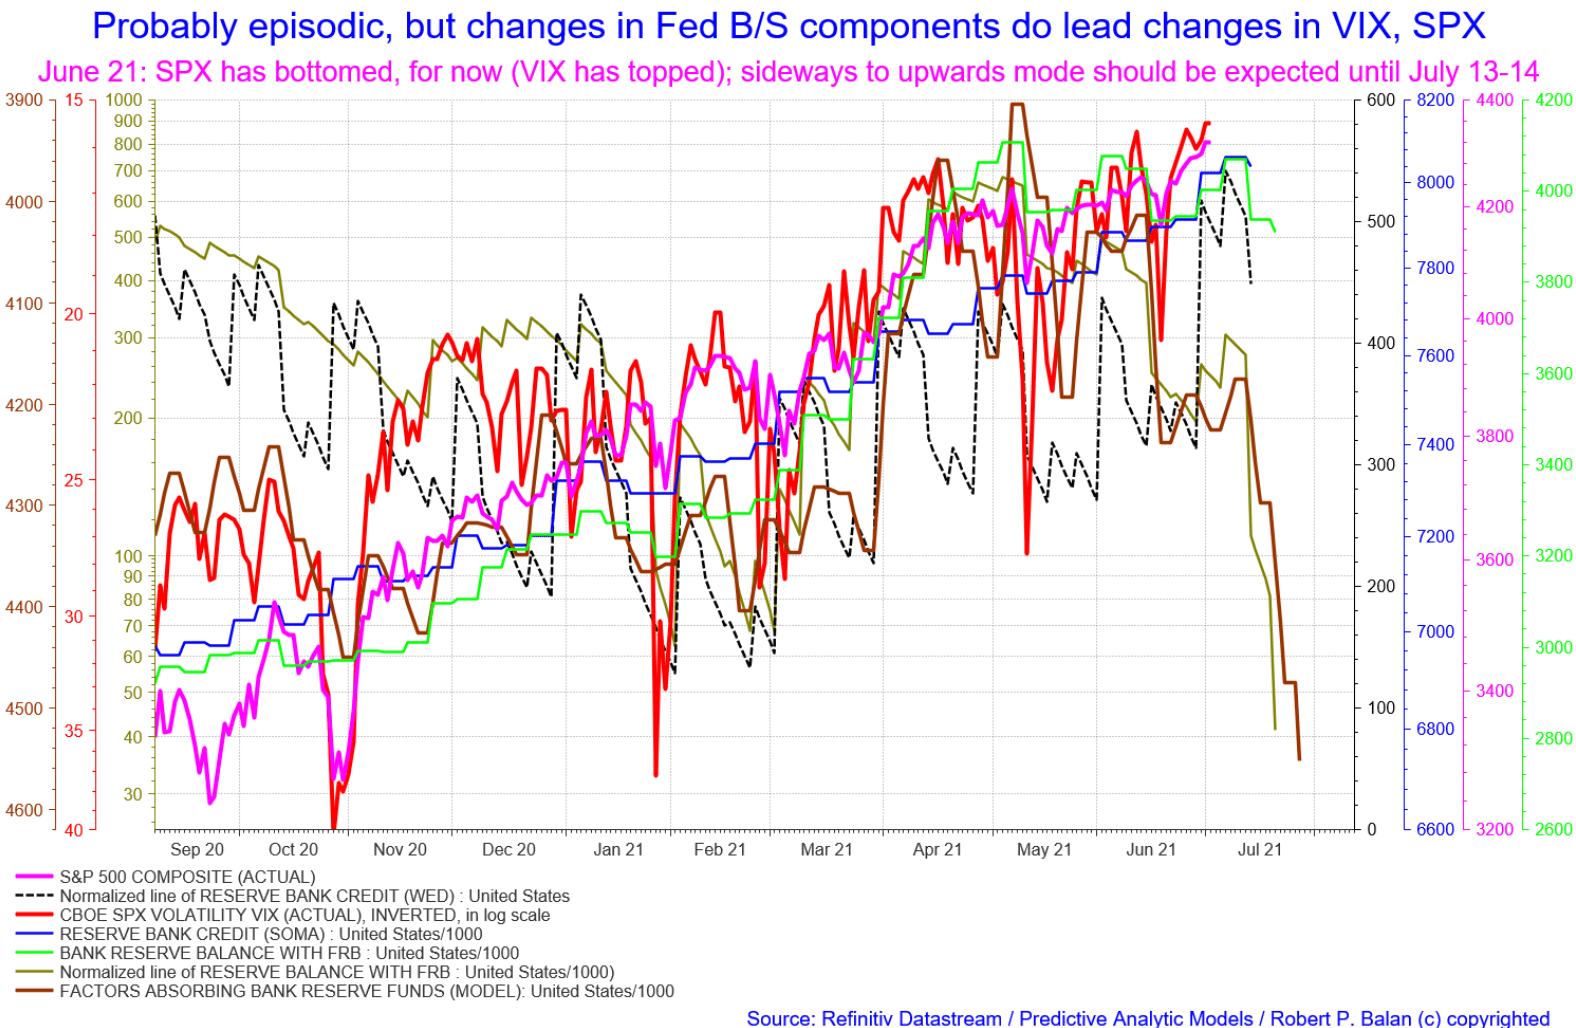
Another reason (3) for putting this all together now, and linking it to the high level of the SKEW Index, is of course our long-held view (since 2 months ago), that we are approaching a major inflection point in the market, from the perspective of Fed Balance Sheet liquidity flows:*
*My long experience showed that MOTUs ALWAYS frontrun the markets (could be a week, could be two), and the only way to keep up pace is to play their game -- that is why we are discussing the jarring stuff now, instead of waiting for mid-July.
From our perspective, however, it does not really matter if the market is indeed going to Hell in a hand basket by middle of July -- we will NOT be Sell & Hold, except for the PAM membership who will do it with OTM options, in pretty much the same way we suspect the MOTUs are starting to do.**We will follow the selling waves as/if they occur; disengaging, and then doing it again. And again.*
*Meanwhile, there's not much meaningful market moves so far today, so we expect, probably correctly, that the action begins after the Non Farm Payroll data --- a random piece of information that makes no macro sense. But since the Fed made jobs data linchpin of their disengagement strategy, we have no choice but to participate in this madness.
------------------------------------------------------------------------------------
This is the latest performance of PAM's One-Contract Portfolio, with a margin capital of $100,000, making the same trades as the flagship Swing Fund, but doing consistent, one contract-trades.
----------------------------------------------------------------------------------------
Here is the current status of the PAM flagship Swing Fund, which includes open and closed trades.
During the first five months of 2021, PAM delivered phenomenal real-dollar Hedge Fund trading performance, the best at Seeking Alpha:
PAM's flagship Swing Portfolio, year-to-date (May 30, 2021) delivered $97, 370,488.48 net profit on $11,172,813 margin capital.
Year-to-date performance: 830.23%.
........
