


Original Post: https://twitter.com/RobertPBalan1/status/1410586506763411461?s=20
----
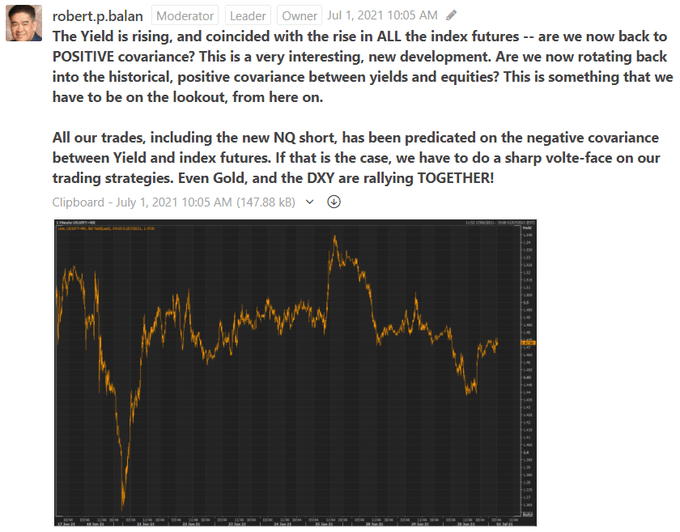
JULY 1 2021 EUROPE OPEN BRIEF: ----The Yield is rising, and coincided with the rise in ALL the index futures -- are we now back to POSITIVE covariance? This is a very interesting, new development. Are we now rotating back into the historical, positive covariance between yields and equities?
All our trades, including the new NQ short, has been predicated on the negative covariance between Yield and index futures. If that is the case, we have to do a sharp volte-face in our trading strategies. Even Gold, and the DXY rallying TOGETHER!
 This old chart, which we posted on June 21 (and updated), shows how the Fed B/S models have tracked the VIX (inverse) and SPX so far. Its clear from the internals of the data (and models) that there is inflection lower from June 30/July1 (NY close basis) until July 6 -- after that we get a new bull phase going into the July 13-14 optimal peak (as suggested by the lagged effect of systemic liquidity flows.
Note that all the activity described is from NY close to NY close basis. The real-time translation of these forecasts into into practical, trade-able data is what we do day by day. It's no different today. But what this tells us is that we should be looking for tops in indexes and trough in the VIX TODAY -- which exactly what we said yesterday.
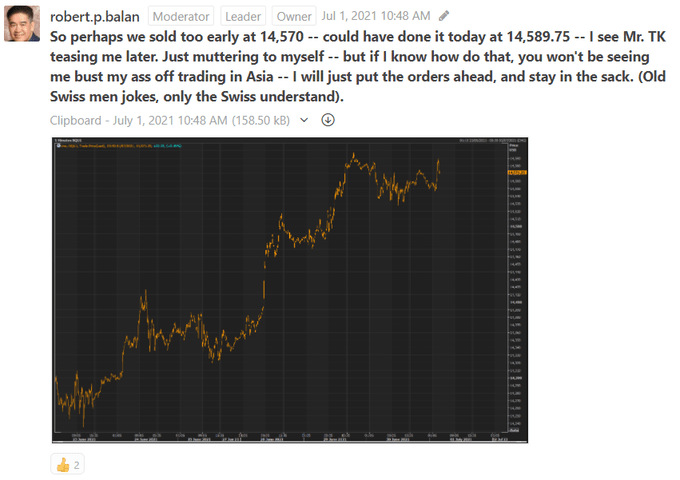
Did we sell too early at 14,570? Should have done it at 14,589.75, I see Mr. TK teasing me. To myself; but if I know how do that, you won't see me bust my ass off trading in Asia; I'll just put the orders on, and stay in the sack. (Old Swiss joke, only the Swiss understand).
 This is our schematic for the YM buying opportunity situation after a top in Europe trade. Maybe this is part of the general weakness until July 6, as portent by the liquidity models. I know Yields are supposed to be rising during that period -- but maybe there will be . . .
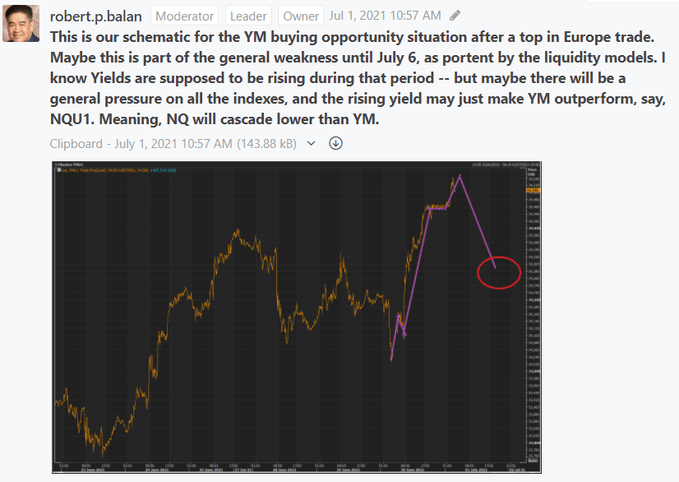 It's pretty much the same outlook for RTY -- looking for test of low pullback to get into long trades. However, I suggest referring to Beam's excellent work on intra-move measurements to get the final details -- these illustrations are done using my "eyeball method" . . .
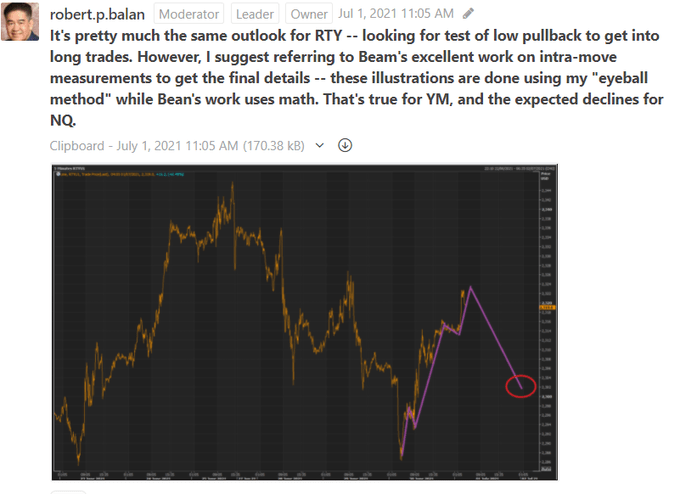 I see the "fives" in the ES price travel as well, so ES may have the same response similar to those of YM; and RTY -- just have no idea how far lower it may go (if at all). Again, Beam's work is best reference for these details.
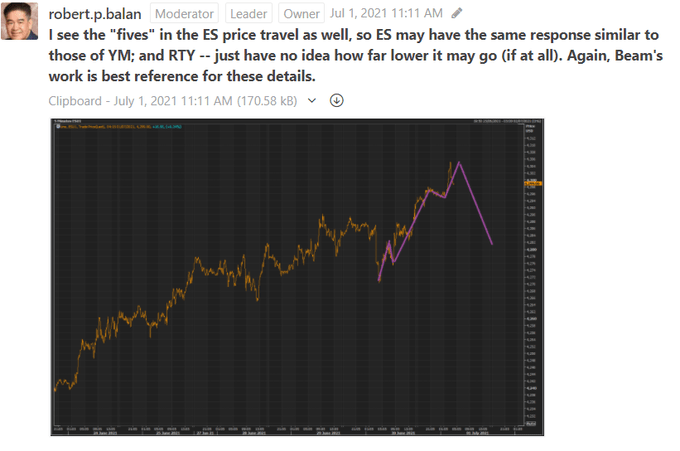 The yield-equity covariance as been all over the place these past two days, so I am being very prudent with my prognostication of possible equity moves, based on the high-frequency changes in the 10Yr Yield.
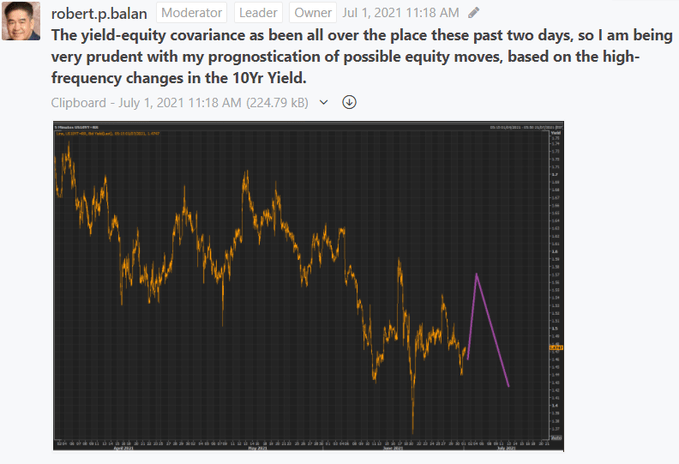 Based on what I am seeing in the Fed B/S liquidity models, yields are now primed to fall off sharply -- and that is regardless of what the equities may do. It's safe to say that equities will lag the Yield's decline, but won't defy any persistent yield downmove for long.
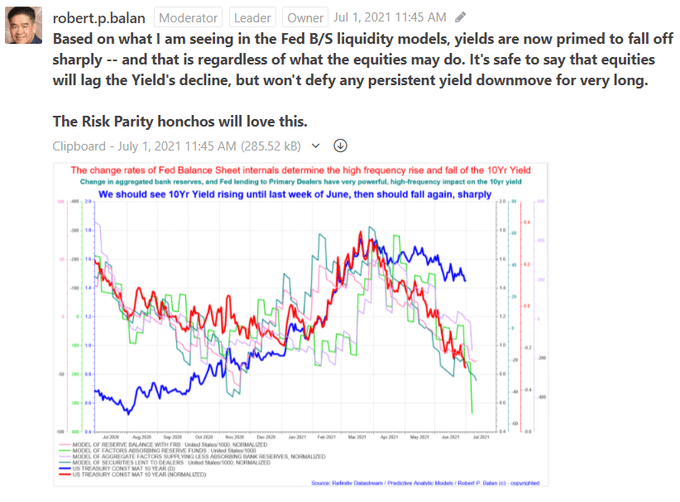 12/12 The the NQ market goes back the way of the Short -- but can't be too smug about it unless the market takes out 14,520 support. If that support goes as well, we put on more Short fuel, this time with some heft.
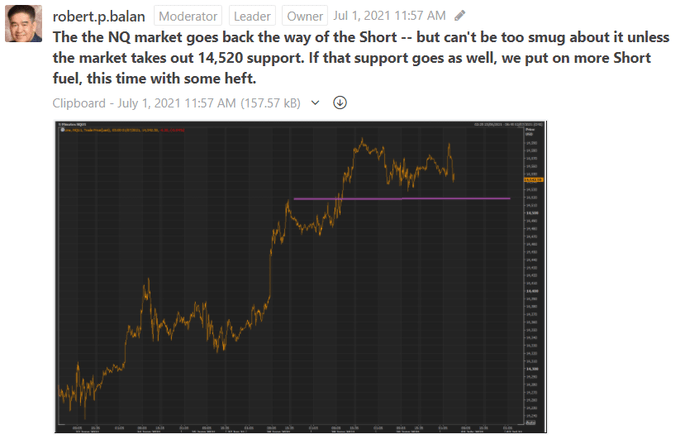
------------------------------------------------------------------------------------
This is the latest performance of PAM's One-Contract Portfolio, with a margin capital of $100,000, making the same trades as the flagship Swing Fund, but doing consistent, one contract-trades.
----------------------------------------------------------------------------------------
Here is the current status of the PAM flagship Swing Fund, which includes open and closed trades.
During the first five months of 2021, PAM delivered phenomenal real-dollar Hedge Fund trading performance, the best at Seeking Alpha:
PAM's flagship Swing Portfolio, year-to-date (May 30, 2021) delivered $97, 370,488.48 net profit on $11,172,813 margin capital.
Year-to-date performance: 830.23%.
........
