
Bruce Hall seems to think calculating 18 month inflation rates (either annualized or not) is just fine. It is just fine. As long as you don’t do it using not-seasonally-adjusted data. If you do that, you really should be clear. Illustrative example for CPI below.
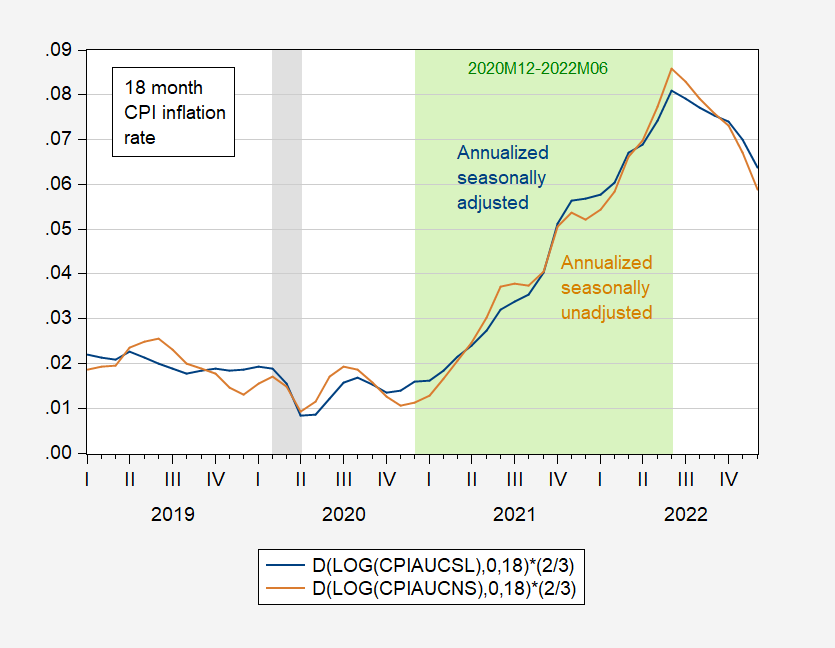
Figure 1: 18 month annualized inflation for seasonally adjusted CPI-urban all consumers (blue), and for not-seasonally-adjusted CPI-urban all consumers (tan), calculated using log differenes. NBER defined peak-to-trough recession dates shaded gray. Source: BLS via FRED, NBER, and author’s calculations.
My vision last time I recall the numbers is 20-400 (rather than 20-20) uncorrected, but even I can see the two series differ substantially at different times.
In case reader CoRev is going to accuse me of manipulating the data, let me note that I use FRED series CPIAUCSL for seasonally adjusted CPI, and CPIAUCNS for seasonally unadjusted. All other calculations are pretty straightforward looking at the formulas in the legend box — unless one is unacquainted with the use of natural logs, or distrusts them. (Here is Jim Hamilton’s post on the use of logs and log-differences, if you don’t trust Menzie Chinn either because of his name or worldviews.)
I must say, 18 months is kinda odd choice. 1 month, 3 month, 12 month, 2 years, 5 years, ok. 1.5 years, well, one should have a reason.
More By This Author:
"Beneath The Stock Market's Surface ... "
Business Cycle Indicators As Of Mid-January 2023
Demographic Variations In Inflation Expectations


Comments
Log in or sign up to join the conversation.