
With the release of December 2022 industrial production (-0.7% vs. -0.1 Bloomberg consensus, m/m), we have the following picture of business cycle indicators followed by the NBER Business Cycle Dating Committee, along with IHS Markit monthly GDP:
(Click on image to enlarge)
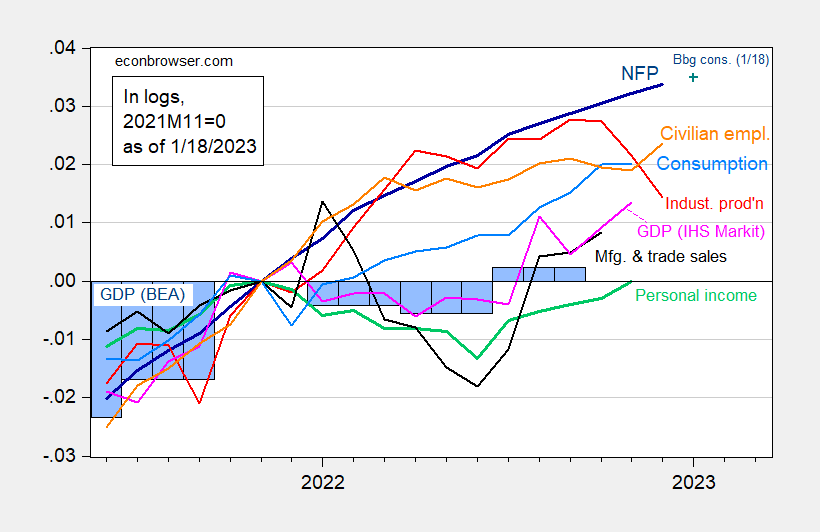
Figure 1: Nonfarm payroll employment, NFP (dark blue), Bloomberg consensus as of 1/18 (blue +), civilian employment (orange), industrial production (red), personal income excluding transfers in Ch.2012$ (green), manufacturing and trade sales in Ch.2012$ (black), consumption in Ch.2012$ (light blue), and monthly GDP in Ch.2012$ (pink), GDP (blue bars), all log normalized to 2021M11=0. Q3 Source: BLS, Federal Reserve, BEA, via FRED, IHS Markit (nee Macroeconomic Advisers) (1/3/2023 release), Bloomberg (as of 1/18) and author’s calculations.
The decline in industrial production was a big negative surprise. Taking this report, and others, into account, Atlanta Fed downgraded its nowcast for Q4, from 4.1% q/q SAAR to 3.5%.
(Click on image to enlarge)
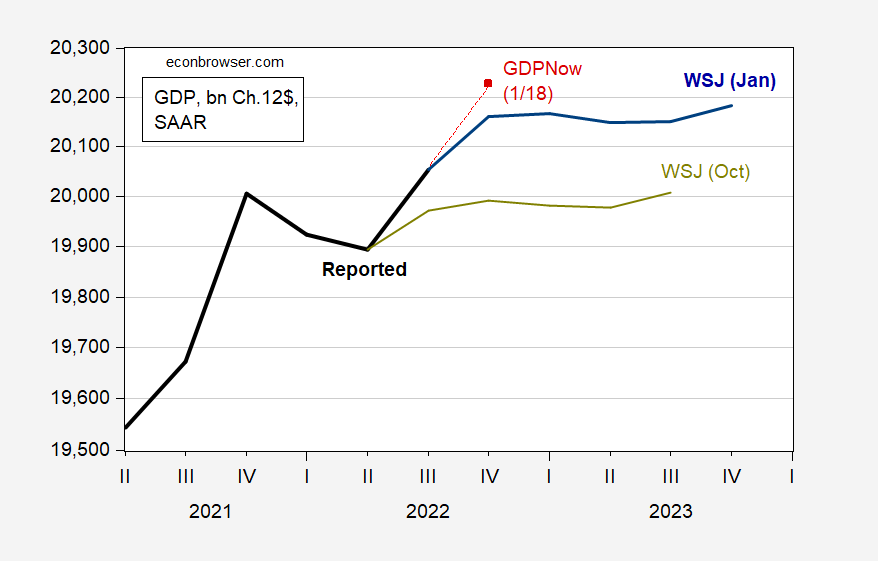
Figure 2: GDP (black), WSJ mean January 2023 survey (blue), October 2022 (chartreuse), GDPNow 1/18/23 (red square). Source: BEA 2022Q3 3rd rel, WSJ (various), Atlanta Fed.
Hence, despite the large drop in industrial production (recall NBER BCDC places primary weight on nonfarm payroll employment and personal income ex-transfers), Atlanta Fed’s count still says positive GDP growth for Q4.
More By This Author:
Demographic Variations In Inflation ExpectationsMore On An Inflation Regime Switch
December 2022 CPI


Comments
Log in or sign up to join the conversation.