
What To Learn From The Latest CoT
Following futures positions of non-commercials are as of August 17, 2021.
10-year note: Currently net long 145.2k, up 36.4k.
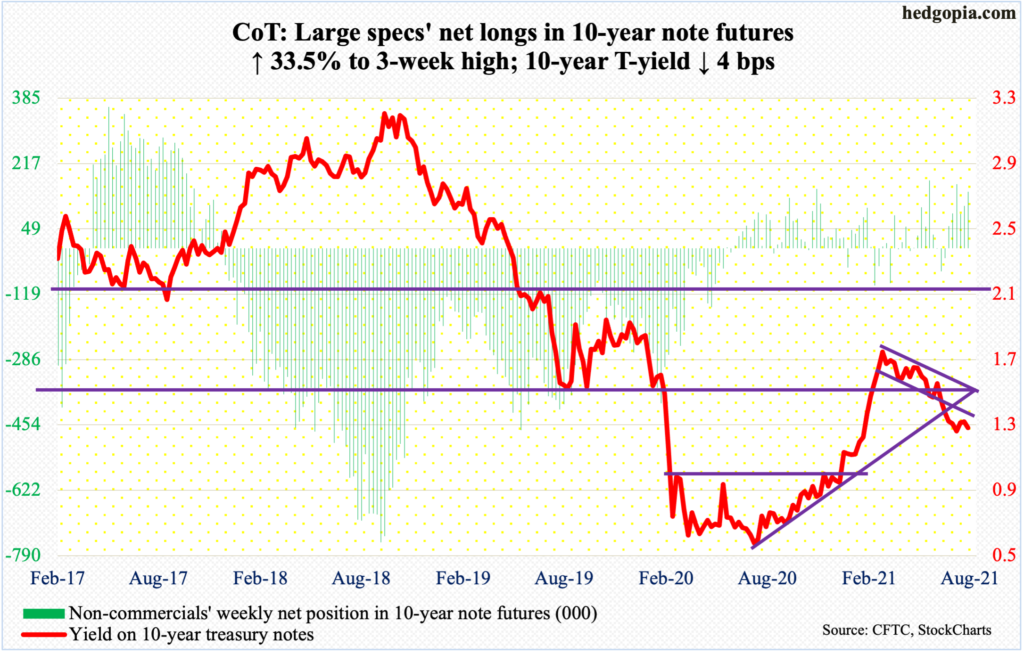
Next week is the annual Jackson Hole symposium, where Jerome Powell, Federal Reserve chair, will (virtually) speak on “the economic outlook” It is a rather vague topic, but markets will be all eyes and ears as to what he would say about tapering. He is scheduled to speak on Friday at 10 a.m. EDT.
This week’s minutes for the July 27-28 FOMC meeting showed that members were beginning to coalesce around tapering to begin toward the end of the year.
Currently, the Fed spends up to $80 billion in treasury notes and bonds and $40 billion in mortgage-backed securities every month. It is sitting on $8.34 trillion in assets, up from $4.24 trillion in early March last year. Back then, Covid-19 essentially caused the US economy to ground to a halt. Help was needed, and the Fed got into action, providing massive stimulus. Now, several metrics, including real GDP, have surpassed the pre-pandemic high. The economy is no longer in crisis and is in no need of the stimulus.
Chair Powell has an opportunity next Friday to lay out a roadmap as to how to go about reducing the bloated balance sheet. Should tapering indeed begin, the bigger question is how equities would react to it. This week, amidst rising odds of tapering, bulls took a defensive stance, although buy-the-dip mentality was very much at work. Even more intriguing is, at what point would the Fed stop, or reverse, tapering – is it the S&P 500 down five percent, 10 percent, or higher?
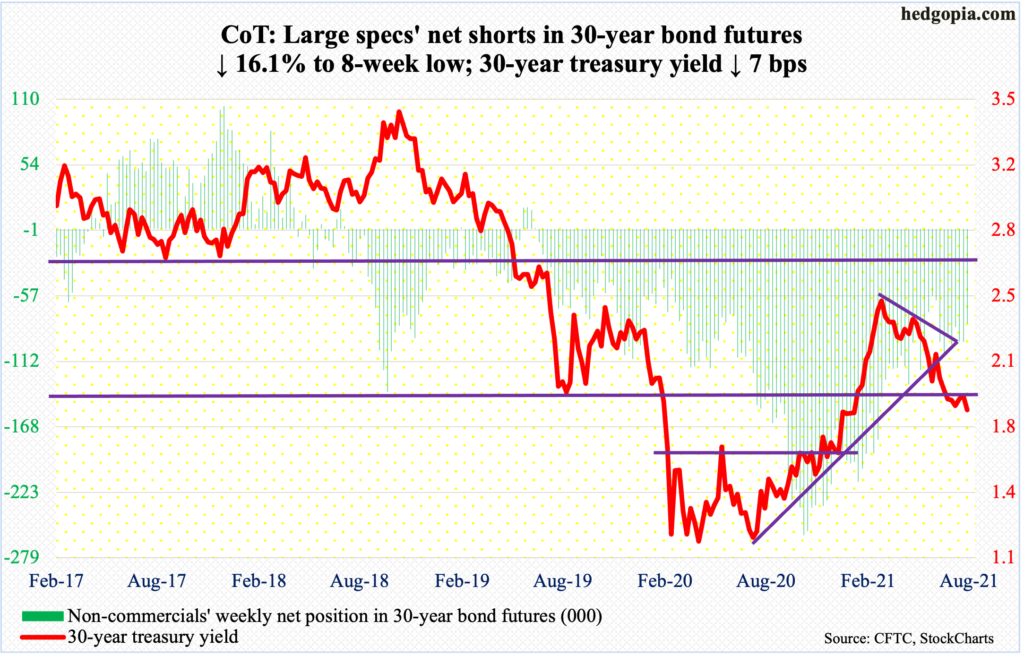
30-year bond: Currently net short 80.2k, down 15.4k.
Major economic releases for next week are as follows.
Existing home sales (July) will be published on Monday. Sales in June rose 1.4 percent month-over-month to a seasonally adjusted annual rate of 5.86 million units – a three-month high.
Tuesday brings new home sales (July). In June, sales declined 6.6 percent m/m to 676,000 units (SAAR), much slower than January’s 993,000 pace.
On Wednesday, orders for non-defense capital goods ex-aircraft (July) – proxy for business capex plans – are due out. June orders were up 18.6 percent year-over-year to $76.3 billion (SAAR), which was a new record.
GDP (2Q21, 2nd print) and corporate profits (2Q21) come out on Wednesday. The first print showed real GDP grew at an annual rate of 6.5 percent last quarter.
Corporate profits adjusted for capital consumption and inventory valuation increased 5.1 percent quarter-over-quarter in 1Q21 to $2.55 trillion – a new high.
Personal income/spending (July) and the University of Michigan’s consumer sentiment index (August, final) are scheduled for Friday.
Core PCE, which is the Fed’s favorite measure of consumer inflation, jumped 3.54 percent in the 12 months to June. This was the fastest price appreciation in 30 years.
August’s preliminary reading showed consumer sentiment tumbled 11 points m/m to 70.2, which undercut the post-pandemic low of 71.8 from April last year.
WTI crude oil: Currently net long 384.5k, down 6.9k.
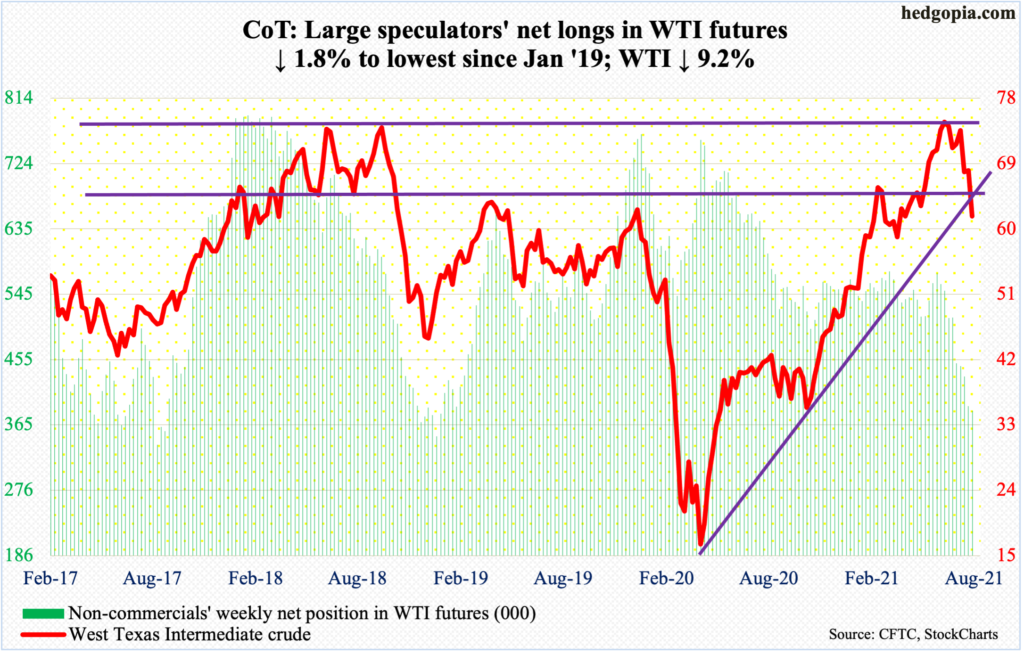
Oil bulls could no longer hold $65. Last Monday, the low from July 20 was defended. This week, the support gave way on Thursday. Before this, WTI ($62.14/barrel) lost $66-$67.
The crude has come under persistent pressure after getting rejected just under $77 on July 6. This was a level last touched in October 2018. So, it is a double top. A rising trend line from the low of March last year has been breached.
The 200-day moving average lies at $60, which may just act like a magnet near term.
In the meantime, US crude production in the week to August 13 increased 100,000 barrels per day to 11.4 million b/d. Gasoline stocks rose as well, up 696,000 barrels to 228.2 million barrels. Crude and distillate stocks, however, fell – down 3.2 million barrels and 2.7 million barrels to 435.5 million barrels and 137.8 million barrels respectively. Refinery utilization inched up four-tenths of a percentage point to 92.2 percent. Crude imports dropped 46,000 b/d to 6.4 mb/d.
E-mini S&P 500: Currently net long 27.3k, up 4.2k.
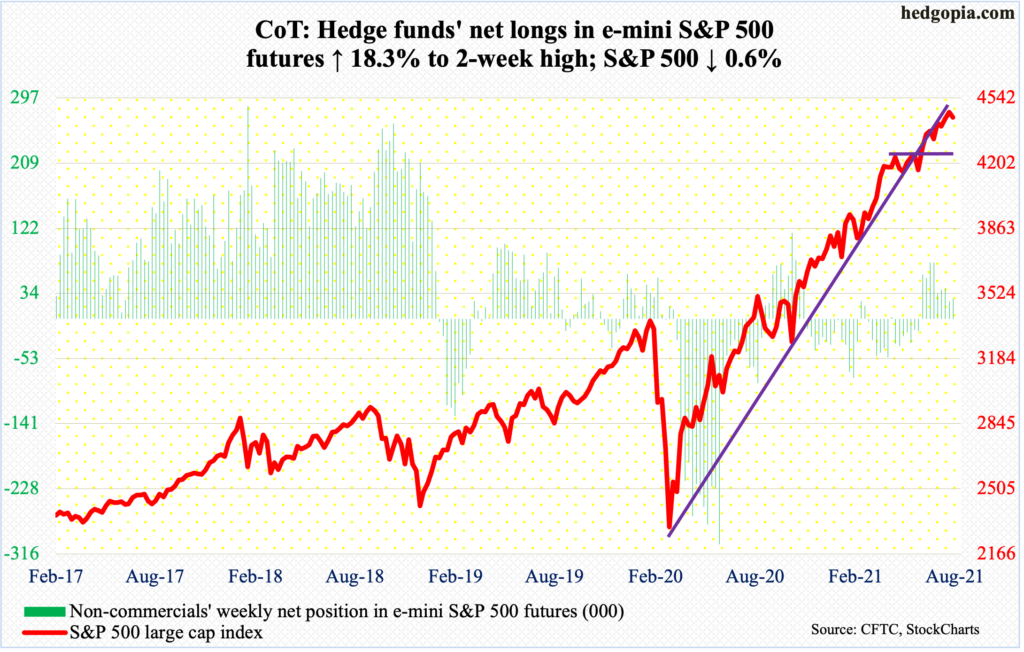
At Thursday’s low of 4368, the S&P 500 was 0.4 percent from its 50-day; in fact, in the overnight session the large cap index was down nearly 50 points at one time and just about tested the average, drawing bids. In the regular session on Thursday, the index reversed from down 0.7 percent at the lows to up 0.1 percent. On Friday, it rallied 0.8 percent to end the week down only 0.6 percent.
The index remains overbought on nearly all timeframes, having gone parabolic since the low of March last year. Through Monday’s all-time high of 4480, it more than doubled from that low.
Interestingly, despite this week’s rather defensive posture, flows were very good. In the week to Wednesday, US-based equity funds gained $13.9 billion (courtesy of Lipper) and SPY (SPDR S&P 500 ETF), VOO (Vanguard S&P 500 ETF) and IVV (iShares Core S&P 500 ETF) took in $9.2 billion (courtesy of ETF.com). This marked four weeks of inflows in a row, having attracted $14.9 billion and $2.3 billion respectively in the prior three.
Bears will have the upper hand once the 50-day (4353) succumbs to selling pressure. Going back to May last year, the average has been saved 10 times, including this week’s (more on this here). Having put their foot down near important support this week, bulls have the advantage.
Euro: Currently net long 57.6k, up 23.8k.
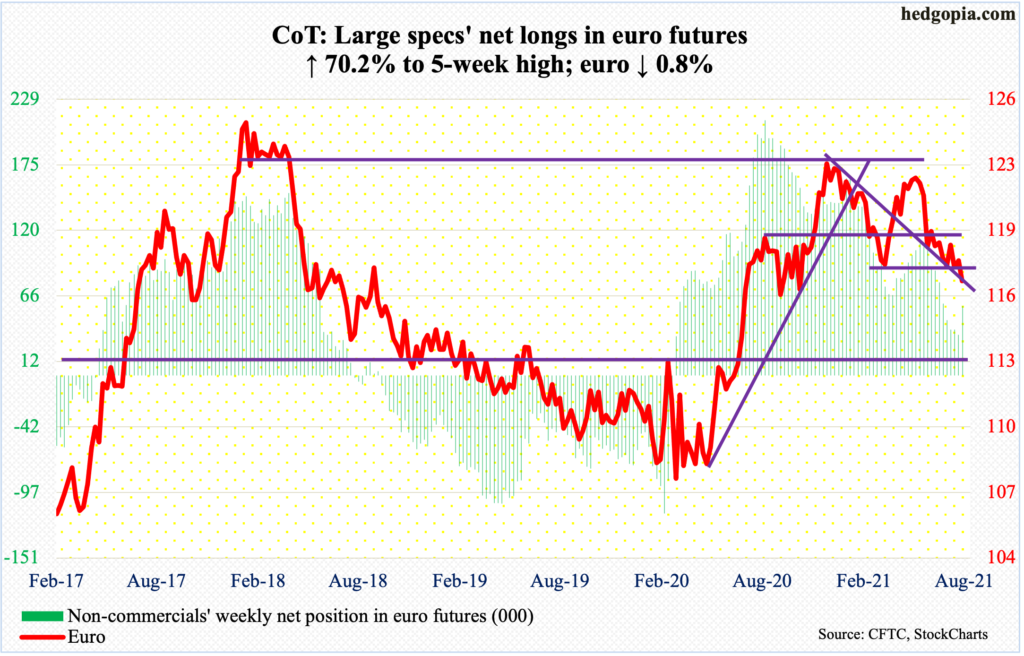
Last Tuesday, the euro dropped to $1.1710 to successfully test the March 30 low of $1.1712; the subsequent rally stopped right at $1.18 resistance last Friday. This Friday, the currency dropped as low as $1.1664, before closing at $1.1699.
Bulls need to hold support just north of $1.16. A breach opens the door toward $1.15.
This week, non-commercials, for a change, added to their net longs, to a five-week high.
The daily can rally. Immediately ahead, there is resistance at broken support at $1.1710s, followed by $1.1750s.
Gold: Currently net long 191.5k, up 23.1k.
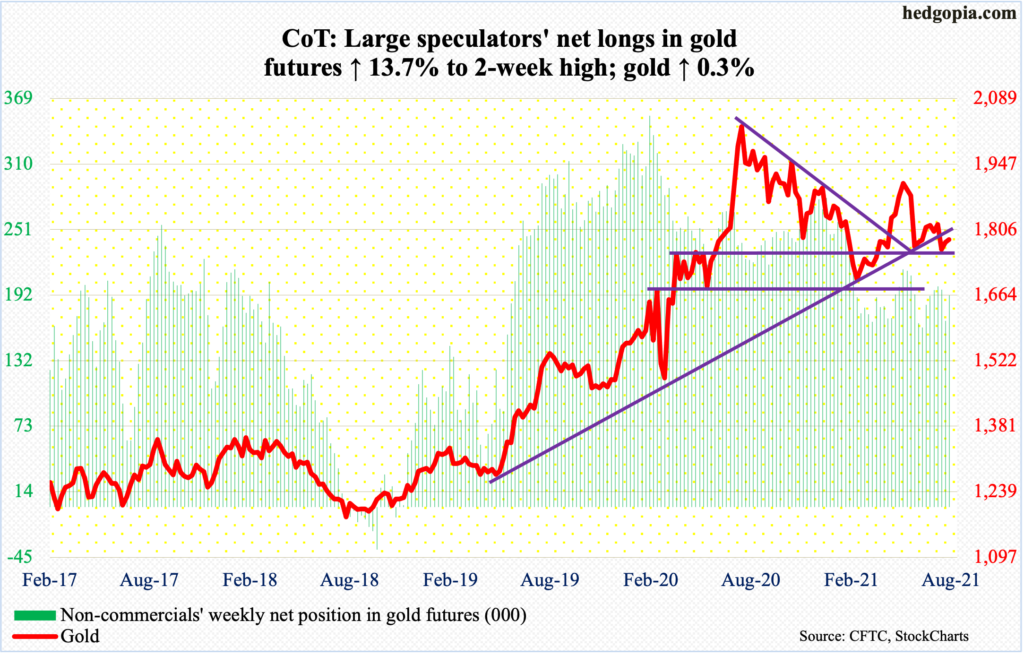
Gold ($1,784/ounce) tried to reclaim $1,800 several times this week, but unsuccessfully. Several daily indicators such as the RSI are also facing resistance at the median.
Should weakness develop near term, there is major support at $1,760s-$1,770s. Last Monday’s breach of this level resulted in a hurried test of $1,670s, which held.
Gold bugs deserve the benefit of the doubt. But at this point they need flows to cooperate. In the week to Wednesday, GLD (SPDR Gold ETF) and IAU (iShares Gold Trust) lost $482 million and $92 million (courtesy of ETF.com). Since the week to June 2, they respectively lost $1.6 billion and $212 million. On June 1, the metal retreated after posting $1,919 – failing to recapture $1,920s.
Non-commercials, too, have been reducing net longs; this week, they added some.
Nasdaq 100 index (mini): Currently net short 21.9k, up 8.7k.
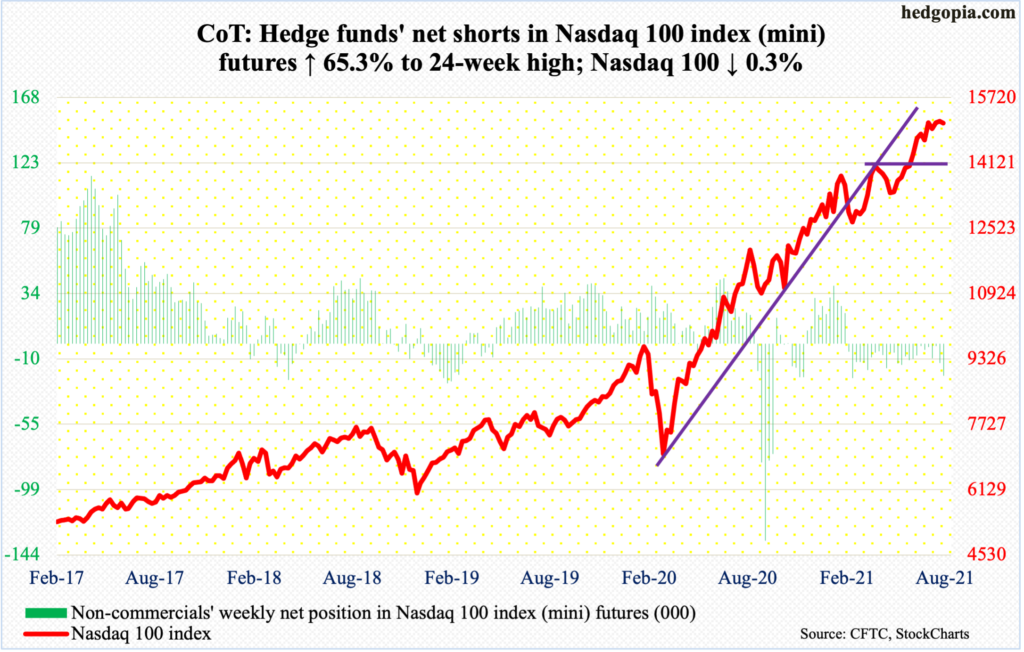
Yet another week in which the Nasdaq 100 failed to clear 15100s. This has gone on since July 23. By Thursday, it was down to 14773 intraday. From tech bulls’ perspective, the good thing is that that low was bought just above the 50-day. By the end of the week, a weekly dragonfly doji formed back-to-back. This is a potential bearish candle but needs confirmation.
The index ended the week at 15093 – right on resistance. It is itching to break out.
Should the 50-day break, bulls can still do damage repair by defending 14550s, a loss of which can result in the index quickly head toward 14000.
Russell 2000 mini-index: Currently net short 64.7k, up 7.2k.
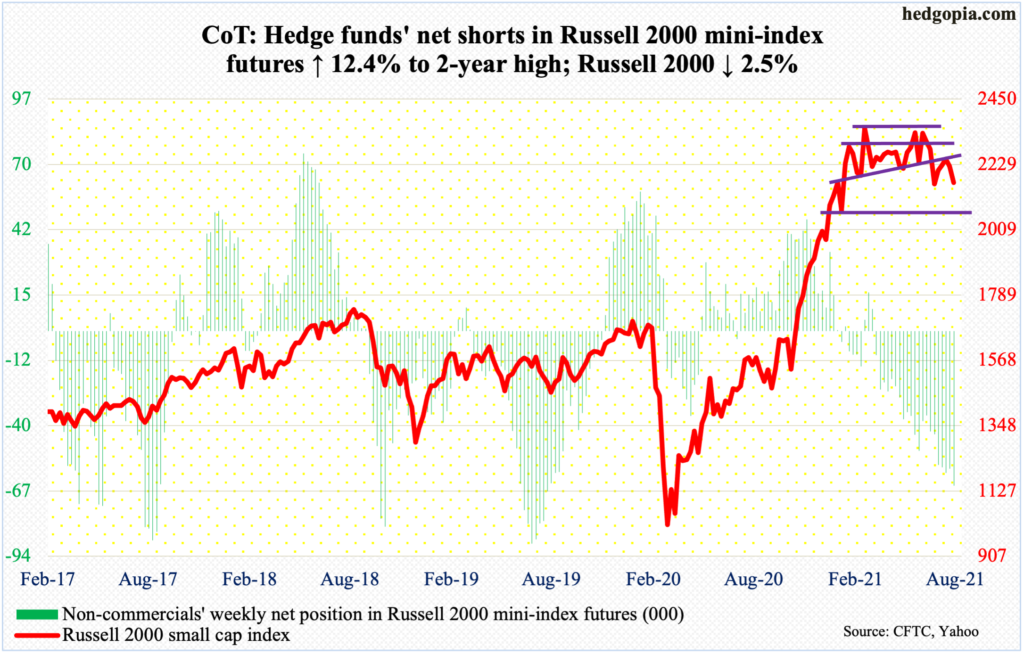
It increasingly feels like it is just a matter of time before the Russell 2000 suffers a range breakdown. The small cap index (2168) has played ping pong between 2350s and 2080s since mid-March. The lower bound was successfully tested mid-July, but the subsequent rally repeatedly failed at 2250s.
On Thursday this week, the index dropped to 2122 intraday before drawing bids. This was followed by Friday’s drop to 2127 which again elicited buying interest.
In the sessions ahead, bulls hope to at least test 2250s, and ideally, 2280s.
A decisive breach of the rectangle opens the door toward 1800 – at least technicians would be eyeing that level should bears prevail and force a five-plus-month box breakdown.
US Dollar Index: Currently net long 19.2k, down 115.
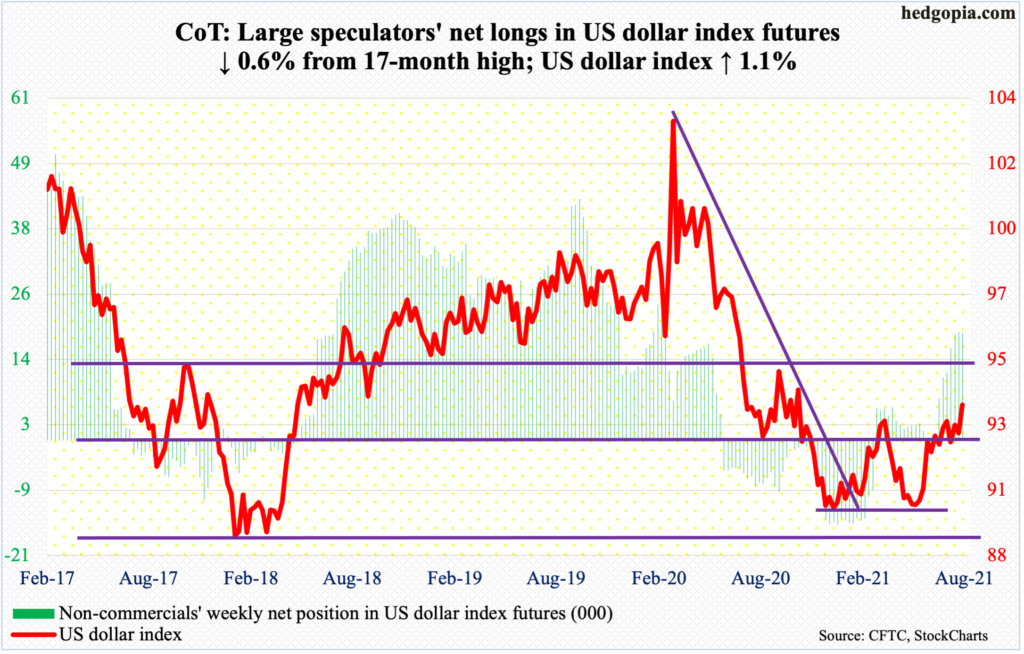
The US dollar index (93.51) on Thursday staged a mini breakout just north of 93, ticking 93.61, followed by Friday’s 93.75. This took out the March 31 high of 93.47. This now establishes a pattern of higher highs. There is already a pattern of higher lows in place, with the index having dropped to 89.17 in January and 89.51 in May.
Thursday’s is probably a w breakout. Time will tell. If it is, technicians in due course would be eyeing 97. But a lot has to go right in this scenario. Bulls need to defend 93, or just north of 92 in a worse-case scenario and relaunch from there.
VIX: Currently net short 86.8k, up 12.6k.
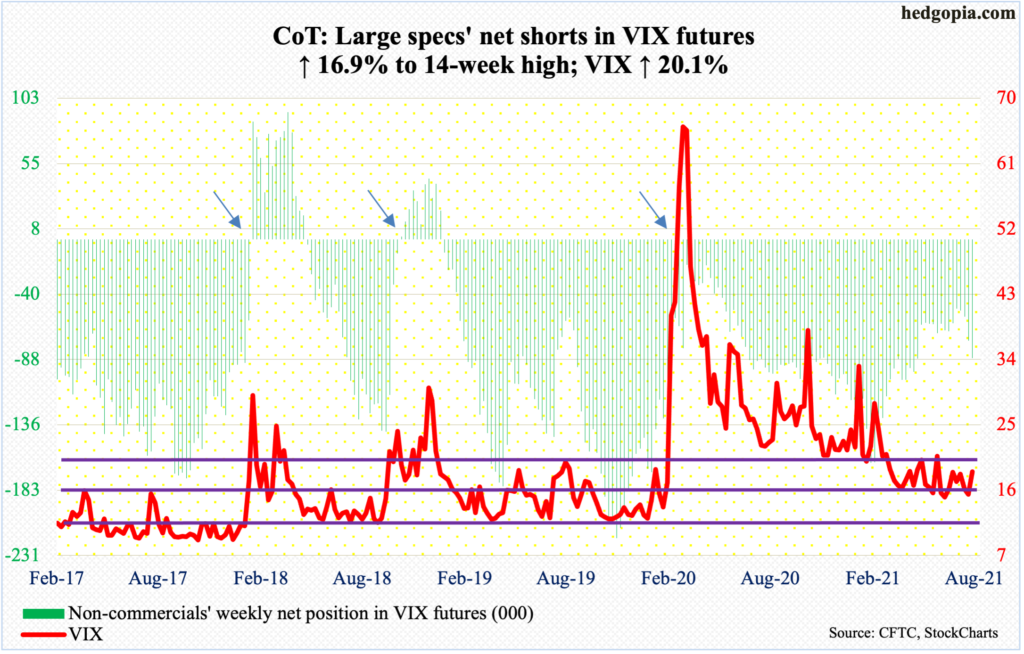
Thursday’s intraday high of 24.74 just fell short of eclipsing the July 19 high of 25.09. This was yet another lower high since VIX (18.56) surged to 85.47 in March last year.
Be that as it may, volatility bears were unable to make much of the breach 12 sessions ago of a month-and-a-half rising trend line (more on this here). Last Friday’s low of 15.19 just above the daily lower Bollinger band held.
In a seasonally favorable period for volatility, the monthly has plenty of room to rally. Although immediately ahead, VIX likely comes under downward pressure.
Ahead of this, non-commercials raised their net shorts to a two-year high.
Disclaimer: This article is not intended to be, nor shall it be construed as investment advice. Neither the information nor any opinion expressed here constitutes an offer to buy or sell any ...
more

