

Image Source: Pexels
WEI continues to decline.
(Click on image to enlarge)
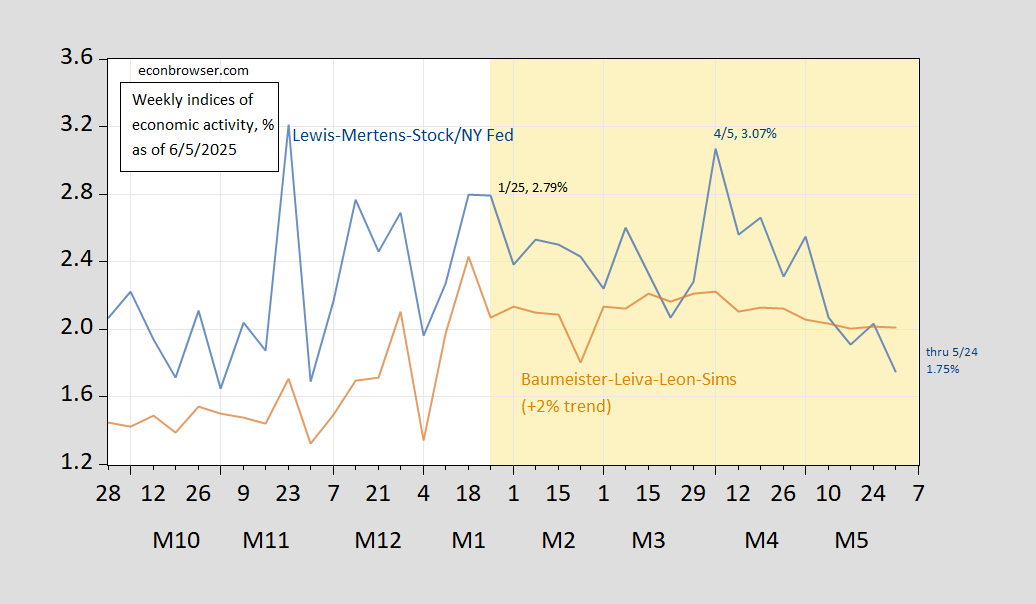
Figure 1: Weekly Economic Index (blue), and Baumeister, Leiva-Leon, Sims Weekly Economic Conditions Index plus 2% (tan), both annualized %. Source: NY Fed via FRED, Baumeister et al.
I think that the tumult due to the on-off-on again tariffs provides a cautionary note about using past correlations to infer current conditions. Note that the Weekly Economic Index (Lewis-Mertens-Stock) jumps around “Liberation Day”; did this represent actual higher production sales? I think partly no, insofar as the weight on railroad freight is 0.3, and so part of the movement in WEI is due to front-loading imports and associated transport to stockpiles.
More By This Author:
GDPNow Bounceback (Kind Of)
Trump Predicts At Least 3% Growth
GDP And “Core GDP” Nowcasts


Comments
Log in or sign up to join the conversation.