
At least it’s mercifully less than the 4% that he promised last time (but 9% is more than last time).
This is what 3% looks like:
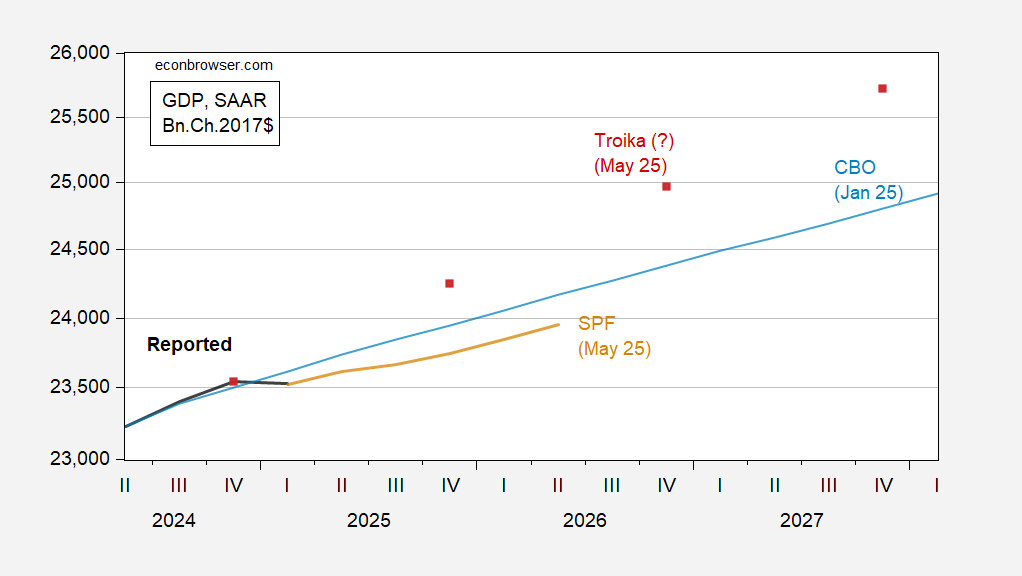
Figure 1: GDP (black), CBO (light blue), Troika inferred from Trump remarks at 3% (red squares), and May Survey of Professional Forecasters median (tan), all in bn.Ch.2017$ SAAR. Source: BEA 2025Q1 second release, CBO (January 2025), TruthSocial post of 30 May 2025, Philadelphia Fed (May 2025), and author’s calculations.
Here’s a picture of last time Trump promised something about growth (incorporating TCJA):
(Click on image to enlarge)
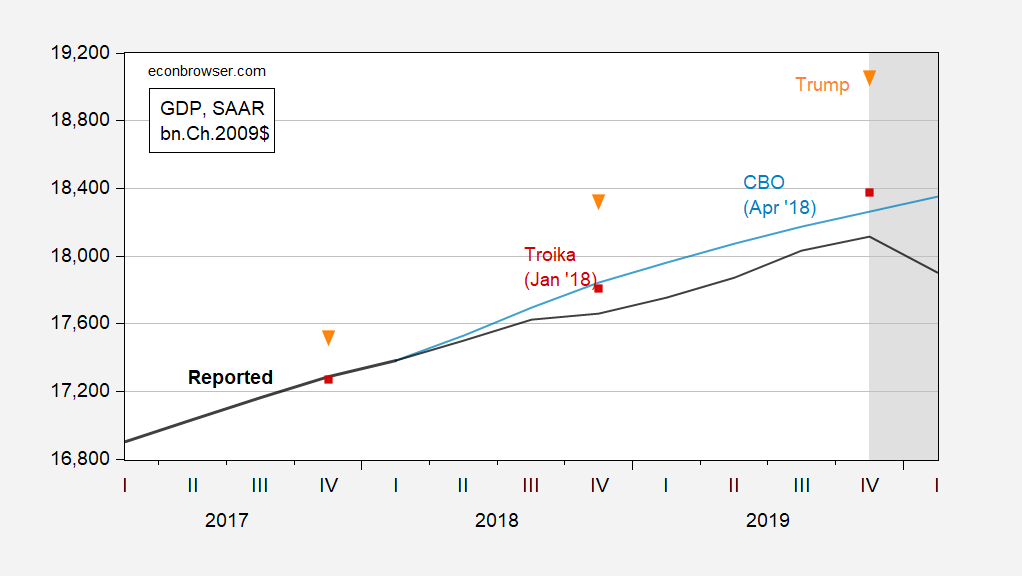
Figure 2: GDP (black), CBO (light blue), Troika/Administration (red square), Donald Trump (orange inverted triangle), all in bn.Ch.2009$ SAAR. NBER defined peak-to-trough recession dates shaded gray. Source: BEA, CBO (April 2018), Economic Report of the President, 2018, CNBC, NBER, and author’s calculations.
More By This Author:
GDP And “Core GDP” Nowcasts
Measured Trade Policy Uncertainty Spikes
Nowcasted Equipment Investment Decelerates


Comments
Log in or sign up to join the conversation.