

Image Source: Pexels
Graph for data through 5/30 for Baker, Bloom and Davis index.
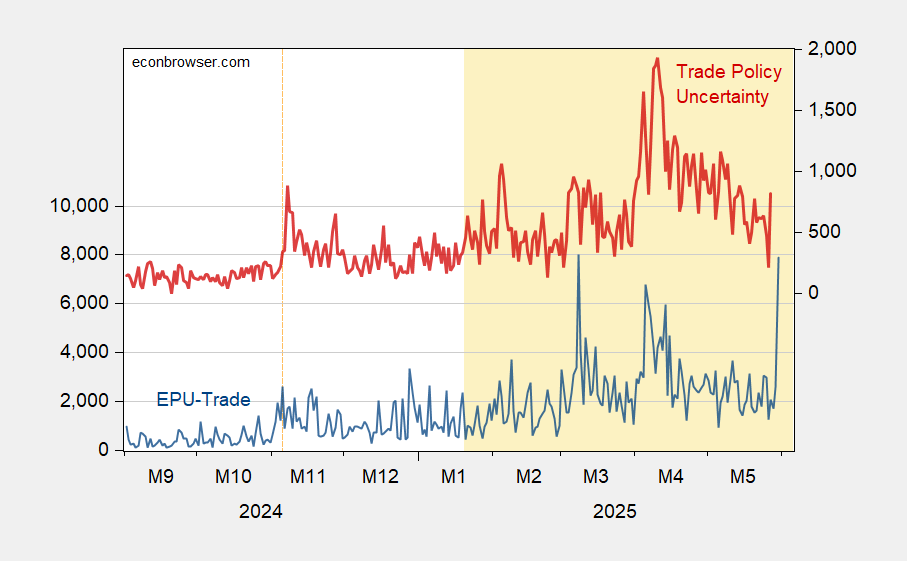
Figure 1: EPU-trade category (blue, left scale), and Trade Policy Uncertainty index (red, right scale). Source: Baker, Bloom & Davis policyuncertainty.com, and Caldara et al. TPUD.
More By This Author:
Nowcasted Equipment Investment DeceleratesDespite Upward Revisions, Sentiment Still Looks Pretty Poor
Business Cycle Indicators As Reported At May’s End


Comments
Log in or sign up to join the conversation.