

Image Source: Pexels
Why? Q2 equipment investment as implied by GDPNow of 5/30.
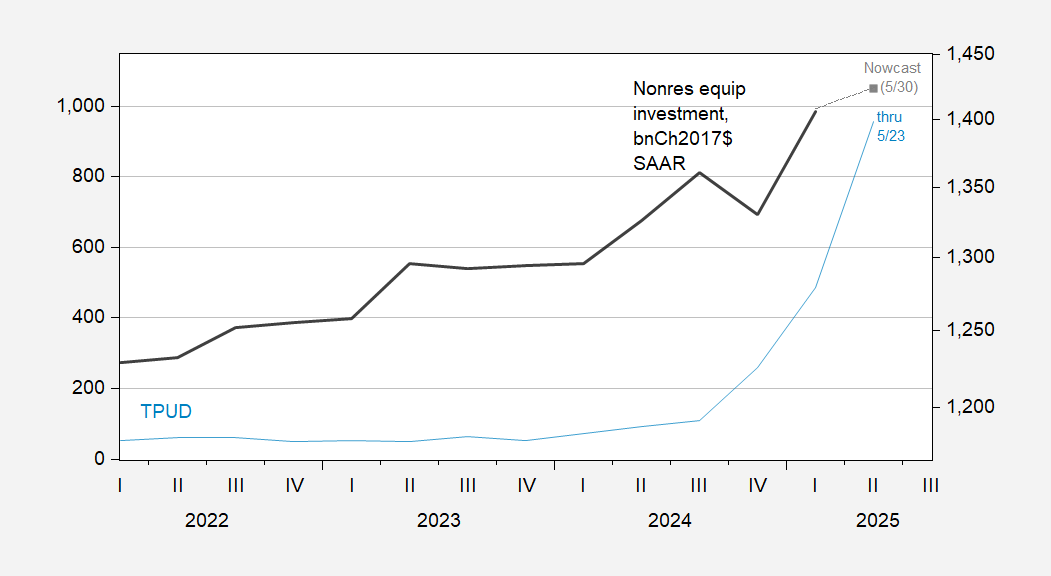
Figure 1: Caldara et al. Trade Policy Uncertainty index (blue, left scale), and nonresidential equipment investment (black, right log scale), and implied by GDPNow of 5/30 (gray square), both in bn.Ch.2017$ SAAR. Source: Iacoviello TPU, BEA 2025Q1 second release, and Atlanta Fed.
Note the spike in trade policy uncertainty (daily data shown here). The accompanying deceleration in equipment investment is consistent with the findings in Caldara, Iacoviello, Molligo, Prestipino, and Raffo “The Economic Effects of Trade Policy Uncertainty,” Journal of Monetary Economics (2020).
How does the Caldara et al. measure compare against the purely news based version of Baker, Bloom and Davis (the categorical component of EPU)? Here’s a graph of standardized (2015-2025M05) indices:
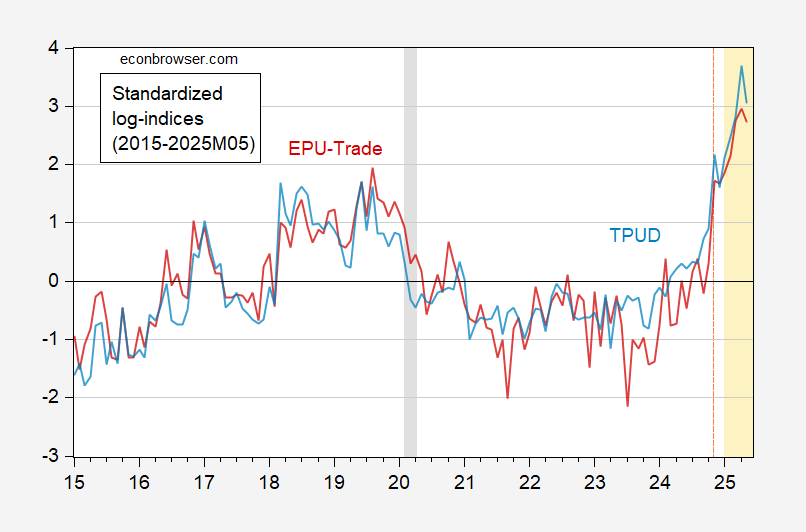
Figure 2: TPUD (light blue), and EPU-trade (red), both standardized over 2015M01-2025M05 period. NBER defined peak-to-trough recession dates shaded gray. Light orange denotes second Trump administration. Source: Iacoviello TPU, policyuncertainty.com, NBER, and author’s calculations.
Both series have shown similar increases since the election.
More By This Author:
Despite Upward Revisions, Sentiment Still Looks Pretty PoorBusiness Cycle Indicators As Reported At May’s End
Economic Activity: GDP, GDO, GDP+, Final Sales


Comments
Log in or sign up to join the conversation.