Weekly Forex Forecast - Sunday, Feb. 23
Image Source: Unsplash
Fundamental Analysis & Market Sentiment
I previously wrote on Sunday, Feb. 16, 2025 that the best trade opportunities for the week were likely to be the following:
- Long of the Nasdaq 100 Index. This fell by 2.48% over the week.
- Long of the S&P 500 Index following a daily close above the 6118.71 mark. This fell by 1.77% over the week.
- Long of gold in US dollar terms (also known as the XAU/USD currency cross) following a daily close of spot gold above the $2,926 mark. This set up on Tuesday, but the price ended the week practically unchanged from there.
- Long of corn futures (the CORN ETF could also be used) following a daily close of the next ZC future at or above 498. This set up on Tuesday, but the price ended the week 2.19% lower.
- Long of coffee futures (the COFF ETF could also be used) following a daily close of the next C future at or above 425.10. This did not set up.
The weekly loss of 6.44% equals 1.29% per asset. However, my weekly forecast about rising yen crosses helped make up some of this loss (3.91%). Meanwhile, last week saw several data releases that affected the Forex market. Such data releases included the following:
- US FOMC Meeting Minutes – this release was slightly hawkish, with the Fed showing it was in no rush to lower rates, as further progress on inflation is required before any further cuts will be made.
- UK CPI (inflation) – this was higher than expected, showing an annualized rate of 3.0% compared to an expected 2.8%, which was hawkish for the British pound.
- Canadian CPI (inflation) – the headline rate showed a month-on-month increase of 0.1%, which was expected, but other inflation metrics ticked a fraction higher.
- Australian Wage Price Index – this came in a fraction lower than forecast, which is very marginally dovish for the Aussie.
- Reserve Bank of Australia Policy Meeting – this release saw rates be cut by 0.25% as expected.
- Reserve Bank of New Zealand Policy Meeting – this release saw rates be cut by 0.50% as expected. This also came with a slight dovish tilt, as the Bank made it clear that the pace of any further cuts would be much slower.
- UK Retail Sales – the month-on-month increase was much stronger than expected, as it rose by 1.7% rather than the forecasted 0.4%, suggesting there is still strong consumer demand and bolstering the higher rate view.
- US, French & German Flash PMI Services & Manufacturing – there was nothing very notable here.
- US Unemployment Claims – this came in almost exactly as expected.
- Canadian Retail Sales – this showed a considerably stronger increase than expected month-on-month, at 2.5% instead of the forecasted 1.5%, suggesting there is still strong consumer demand and bolstering the higher rate view.
Last week’s key takeaways were as follows:
- Despite the hawkish tilt on US monetary policy, and the long-term bullish trend, the greenback declined over the week, showing a bit of weakness in the US dollar right now.
- US stock markets made record highs before dropping quite strongly at the end of last week.
- The Japanese yen saw strong gains last week on strong Japanese economic data, which boosted expectations of Bank of Japan rate hikes.
- Rate cuts continued at many major central banks, even though global inflation seems to be a bit stronger than expected, while the US Federal Reserve has essentially paused rate cuts and the Bank of Japan positioned itself to make rate hikes, placing the yen and the US dollar as divergent currencies from the pack.
- President Trump took a more conciliatory line on tariffs, stating that the EU has been “very nice” while also positioning to impose some reciprocal tariffs on other countries.
- The Trump administration continued talks with Russia over Ukraine, which triggered a boost in risk-on sentiment -- although this sentiment has been patchy, as we saw at the end of last week.
It seems that any flow into safe havens is going to the Japanese yen and maybe gold. A few commodities have been breaking to new record highs, although only gold and corn truly look strong at the moment.
The Week Ahead: Feb. 24-28, 2025
The coming week has a lighter docket of releases scheduled, so we are likely to see a lower level of activity and volatility in the Forex market. The coming week’s important data points, in order of likely importance, are as follows:
- US Core PCE Price Index
- US Preliminary GDP
- German Preliminary CPI
- German Federal Election Result
- US CB Consumer Confidence
- Australia CPI
- Canadian GDP
- US Unemployment Claims
It should be noted that Monday is a public holiday in Japan.
Monthly Forecast for February 2025
(Click on image to enlarge)
For the month of February, I forecasted that the EUR/USD currency pair would decline in value. The performance thus far is shown below.
Weekly Forecast for Sunday, Feb. 23, 2025
Last week, I forecasted that the following currency pairs would fall in value over the week:
- GBP/JPY– down by 1.64%.
- EUR/JPY – down by 2.27%.
This was a good and profitable call. This week, I forecast that the following currency crosses will rise in value over the coming week:
- CAD/JPY
- EUR/JPY
The Japanese yen was the strongest major currency last week, while the euro was the weakest, which put the EUR/JPY currency pair and other yen crosses in focus. Volatility decreased last week as expected, as only 26% of the most important Forex currency pairs and crosses changed in value by more than 1%. Volatility is likely to decline again over the coming week.
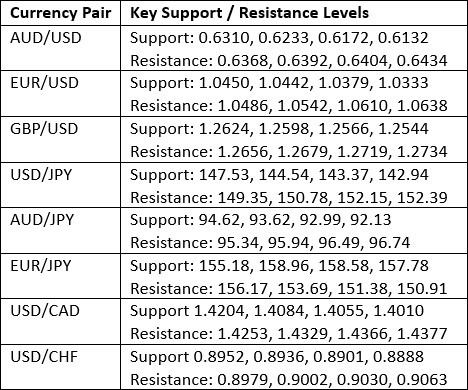
Key Support/Resistance Levels for Popular Pairs
Technical Analysis - US Dollar Index
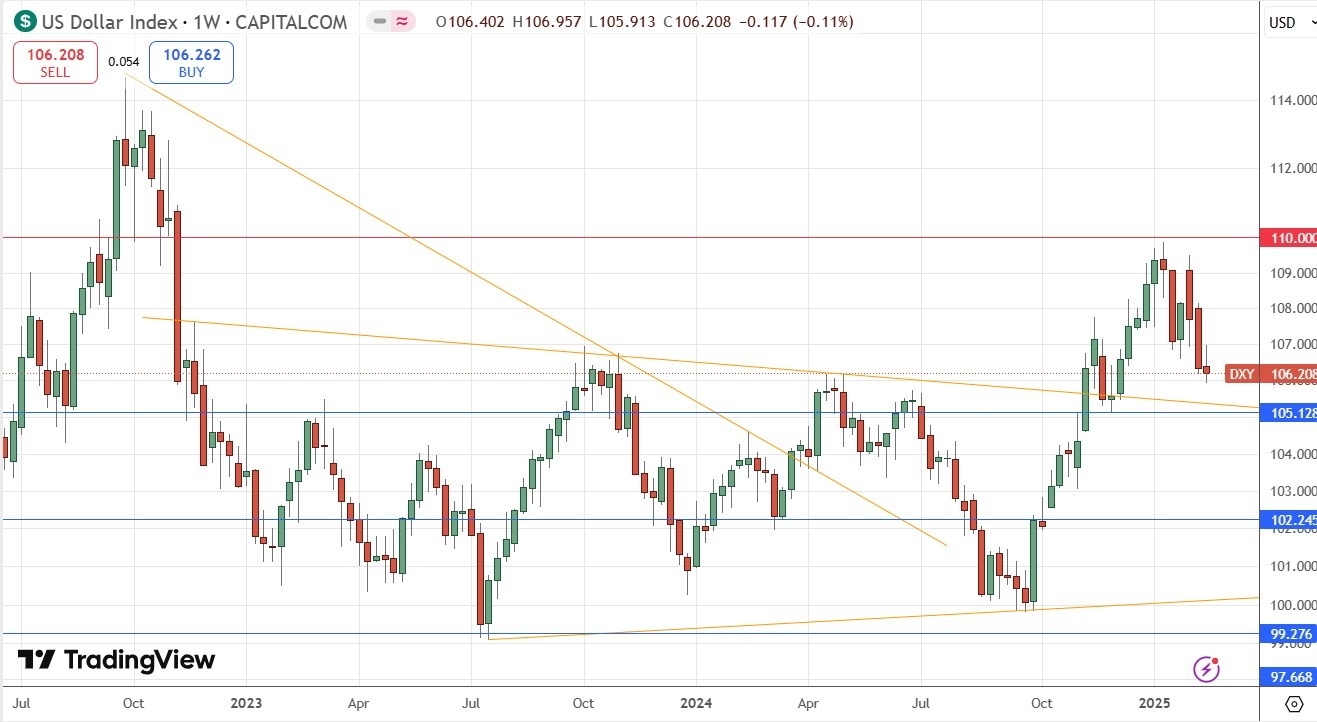
Last week, the US Dollar Index once again moved lower after invalidating the long-term bullish trend the previous week. This followed a major bearish reversal a few weeks ago near the resistance level at 110.00.
It seems clear that the dominant price action is bearish, while the long-term trend is mixed: the price is below its level of three months ago but above its level of six months ago. However, it looks increasingly as if this trend may be over, despite new US tariffs and a more hawkish Fed that is still grappling with inflation above its 2% target, leading to the Fed signaling it is not likely to cut rates any time soon.
The US dollar is likely to continue falling over the coming week, although the bearish momentum has slowed down.
(Click on image to enlarge)
S&P 500 Index
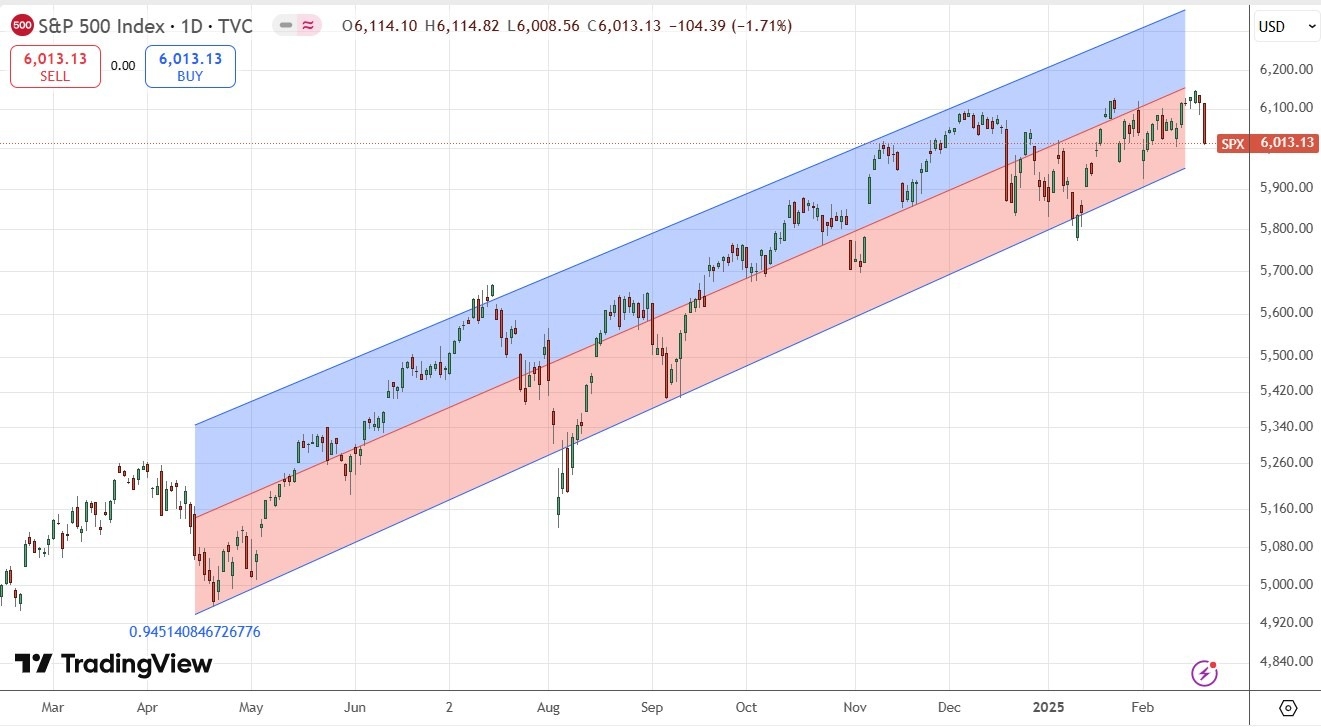
After making a new record earlier in the week, the S&P 500 index made a deep bearish retracement at the end of the trading period. The weekly candlestick closed very near its low, which is a sign of short-term bearish momentum.
Despite this recent bearishness, the linear regression analysis applied to the daily price chart below shows that the current bullish trend has been driving this market for almost two years, which is a relatively mature bull market.
The price is still not far from its record high, and it has continued to make new record highs quite frequently. Therefore, I think that it would make sense to look for a new long trade entry here if a recovery to new highs could occur.
(Click on image to enlarge)
USD/JPY
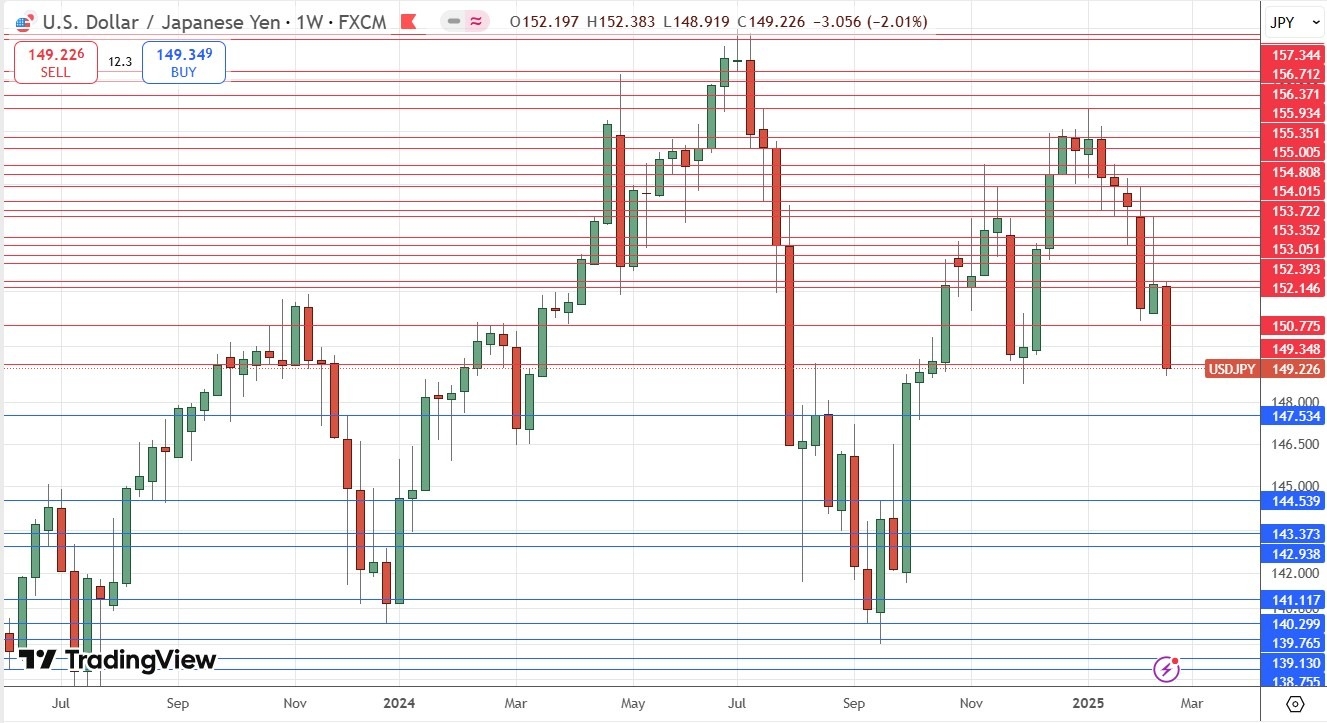
The USD/JPY currency pair printed a large bearish weekly candlestick, as it closed near its low, marking the lowest weekly closing price in almost four months. The price seems to have become established below the big, round number at the JPY150 level. These are all bearish signs.
The driver here is the newly strong Japanese yen, which has begun to jump dramatically every time Japanese economic data is released that shows the return of wage inflation, which is the key catalyst for pushing the Bank of Japan into further rate hikes after more than 15 years with an ultra-dovish monetary policy. Strong Japanese CPI and PMI data have also recently helped boost the yen.
The US dollar has been weak lately despite its strong fundamentals. Although this weakness may be somewhat hard to explain, it can be useful as it may be utilized to exploit the yen's strength.
Despite the bearish momentum seen here, as backed by fundamentals and sentiment, the short-term moving averages remain above the long-term ones, which makes me want to wait a bit longer before entering any new short trades here.
(Click on image to enlarge)
XAU/USD
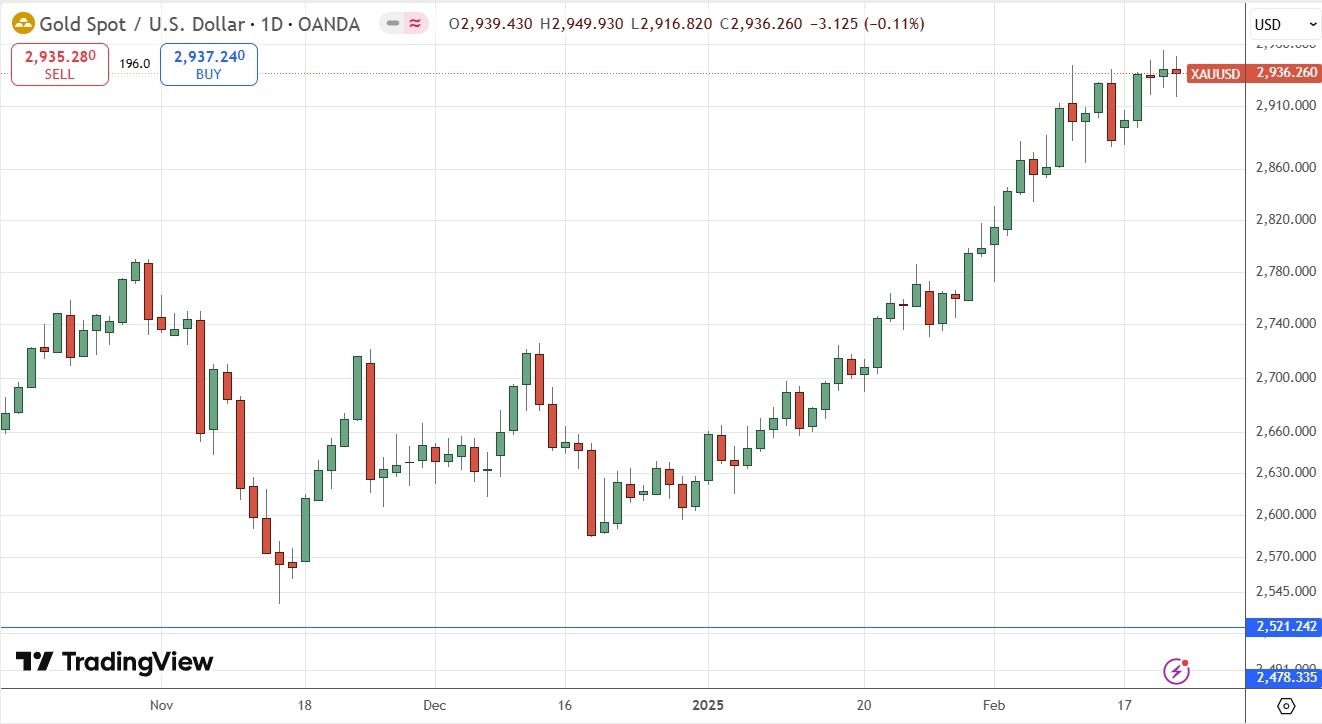
Gold advanced again during the week to reach a new all-time high above $2,950 per ounce. However, the price truly moved little during the week, as it was unable to really make a bullish breakout. However, the price has not been falling either, so the dominant bullish trend should still be respected.
This trend may see a relatively slow rise, but we can see how steadily and strongly gold gained over the past year, so this looks likely to be a solid trend. I am not sure that gold will reach $3,000 per ounce over the coming week, but this target is certainly in sight now.
Gold seems to be doing well in the current market environment, where both risky and safe-haven assets have been performing well -- and gold often plays a role as both.
I’d ideally like to see a new record high daily closing price before entering any new long trade – specifically above the $2,939.39 figure. However, I am long of gold right now, and as the price is so close to this level, it could be worthwhile being long anyway without waiting for a new high closing price.
(Click on image to enlarge)
Corn Futures
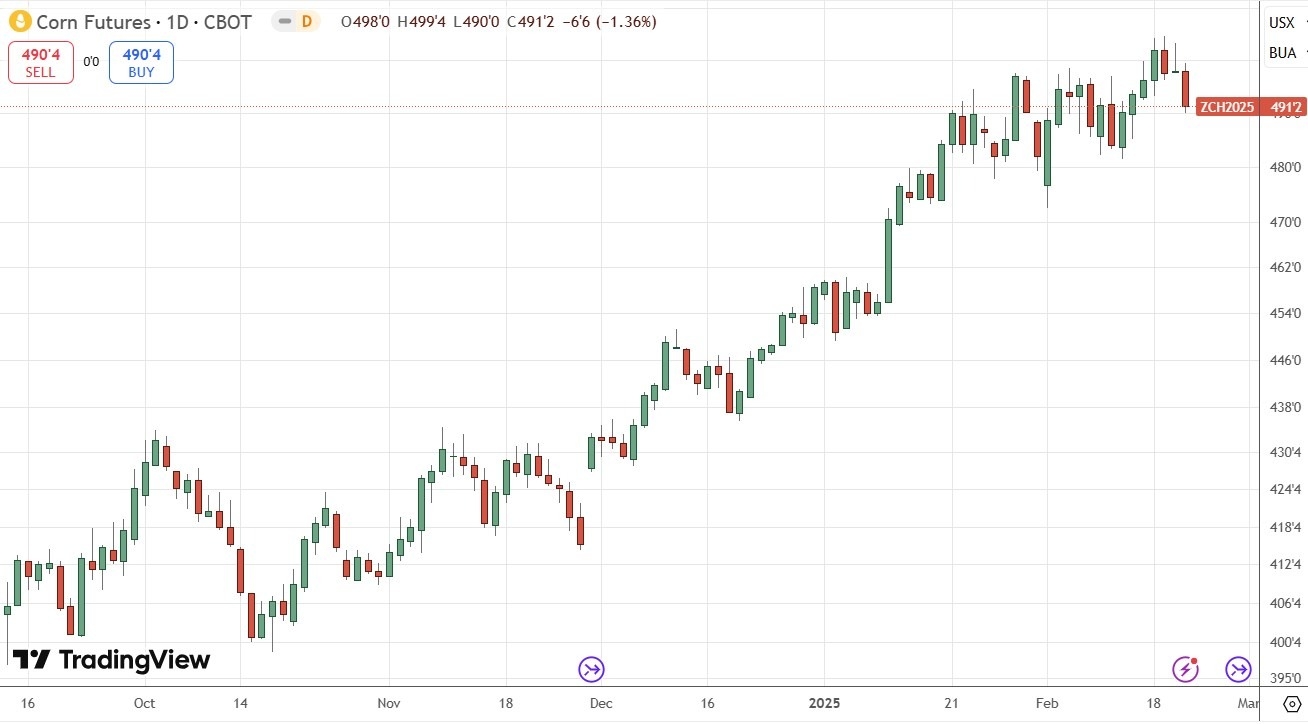
Corn futures have been breaking to new highs recently, as the price of corn traded at a new multi-month high price a couple of weeks ago. However, last week saw a decline.
Many analysts may question the bullish trend here, seeing the recent jump in corn prices as an essentially seasonal development that is sure to end soon. This may be true, but I think when trading commodities it is better to be guided by the price than by your own preferred supply and demand scenario logic.
I think corn would be a buy only if it makes a new daily high closing price, and to me it looks 50-50 chance whether this will happen or not. I will be prepared to enter a new long trade only if we see corn futures make a new six-month high closing price at the end of any day over the coming week, specifically above 502.
(Click on image to enlarge)
Bottom Line
I see the best trading opportunities this week as the following:
- Long of the S&P 500 Index following a daily close above the 6141.60 mark.
- Long of gold in US dollar terms.
- Long of corn futures (the CORN ETF could also be used) following a daily close of the next ZC future at or above 502.
More By This Author:
Forex Today: USD/JPY Falls To 2-Month Low Near ¥150
GBP/USD Forex Signal: Bullish Consolidation Above $1.2572
Forex Today: RBA Cuts Rates For First Time Since 2020
Risk Disclaimer: DailyForex will not be held liable for any loss or damage resulting from reliance on the information contained within this website including market news, analysis, trading signals ...
more


