Weekly Forex Forecast - Sunday, Feb. 16

Image Source: Pexels
Fundamental Analysis & Market Sentiment
I previously wrote on Sunday, Feb. 9, 2025 that the best trade opportunities for the week were likely to be the following:
- Long of gold in US dollar terms (also known as the XAU/USD currency cross) following a daily close of spot gold above $2,867.25. The price fell by 1.57% over the week after this trade set up at Monday’s close.
- Long of corn futures (the CORN ETF could also be used) following a daily close of the next ZC future at or above 498. This did not set up.
- Long of coffee futures (the COFF ETF could also be used) following a daily close of the next KC future at or above 403.95. The price fell by 3.75% over the week after this trade set up at Monday’s close.
The weekly loss of 5.32% equals 1.77% per asset. However, my weekly forecast that yen currency crosses would rise was more than enough to make up for these losses and put the week into profit.
Meanwhile, last week saw several data releases affecting the Forex market. These releases included the following:
- US CPI (inflation) – this came in slightly higher than expected, at an annualized rate of 3.0%, while only 2.9% was expected. The month-on-month increase was higher than expected. This gave a bit of a hawkish tilt on the US dollar, although the greenback still lost value over the week.
- Fed Chair Powell testified before US Congress – the testimony was a bit hawkish while being optimistic on inflation, but Powell made it clear that the Fed is in “no hurry” to cut rates. It is now expected that there will be no further rate cuts in the US over 2025.
- US Retail Sales – this was much worse than expected, showing a month-on-month decline of 0.9% while a decline of only 0.2% was seen as likely. This suggests that the US consumer may be starting to slow down more significantly.
- US PPI – this was a fraction higher than expected, showing a month-on-month increase of 0.4% while 0.3% was expected. This aligns with the slightly higher-than-expected inflation rate.
- UK GDP – this was better than expected, with a month-on-month increase of 0.4% after an increase of 0.1% was seen as likely.
- Swiss CPI (inflation) – this came in as expected.
- New Zealand Inflation Expectations – this came in at 2.06%, which was lower than the previous expected rate of 2.12%.
- US Unemployment Claims – this came in almost exactly as expected.
Additionally, last week’s key takeaways were as follows:
- A more hawkish tilt on rates can be expected from the US Federal Reserve, as inflation ticks fractionally higher and stubbornly refuses to fall to its target at 2%. This leads to the expectation that the Fed will leave rates unchanged for the remainder of 2025. This was backed up by US PPI data.
- Despite the hawkish tilt on US monetary policy and the long-term bullish trend, the greenback declined over the week, which illustrates a kind of weakness in the US dollar right now.
- Stock markets advanced as the “Trump trade” made progress over the week, with the US technology-based Nasdaq 100 Index closing at a record high, with the broader S&P 500 Index trading near its record high which was reached only a few weeks ago.
- The Japanese yen saw strong movement over the week, first losing considerable value on more dovish comments from the Bank of Japan about the future path of rate hikes, but the yen later regained some of its earlier losses.
- There have been muted tariff threats between the US and the EU, but US tariffs have moved out of focus for now.
- The Trump administration had talks with Russia over Ukraine, which triggered a boost in risk-on sentiment, which is a dominant theme right now.
Essentially, we see a more risk-on environment in markets now, with a notable development being the weakening US dollar. It seems that any flow into safe havens would be going to the Japanese yen and maybe gold.
A few commodities have been performing strongly and breaking to new record highs, while a few others are also advancing in value.
The Week Ahead: Feb. 17-21, 2025
The coming week has a lighter schedule of releases expected, so we are likely to see a lower level of activity and volatility in the Forex market. The coming week’s important data points, in order of likely importance, are as follows:
- US FOMC Meeting Minutes
- UK CPI (inflation)
- Canadian CPI (inflation)
- Australian Wage Price Index
- Reserve Bank of Australia Policy Meeting
- Reserve Bank of New Zealand Policy Meeting
- UK Retail Sales
- US, French & German Flash PMI Services & Manufacturing
- US Unemployment Claims
- Canadian Retail Sales
It should be noted that Monday is a public holiday in the US and Canada.
Monthly Forecast for February 2025
(Click on image to enlarge)
For the month of February 2025, I forecasted that the EUR/USD currency pair would decline in value. The performance so far is shown below.
Weekly Forecast for Sunday, Feb. 16, 2025
Last week, I forecasted that the following currency pairs would rise in value over the week:
- AUD/JPY – up by 1.91%.
- CHF/JPY – up by 1.74%.
- EUR/CAD – up by 0.80%.
- EUR/JPY – up by 2.19%.
- NZD/JPY - up by 1.90%.
This was a good and profitable call. This time, I forecast that the following currency crosses will fall in value over the coming week:
- GBP/JPY
- EUR/JPY
The Australian dollar was the strongest major currency last week, while the Japanese yen was the weakest, putting the AUD/JPY currency cross and other yen crosses in focus. Volatility decreased last week as expected, as 41% of the most important Forex currency pairs and crosses changed in value by more than 1%. Volatility is likely to decline again over the coming week.
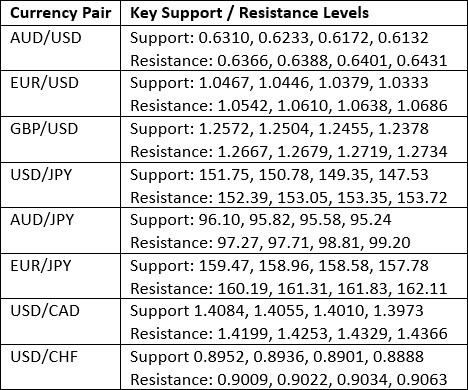
Key Support/Resistance Levels for Popular Pairs
Technical Analysis - US Dollar Index
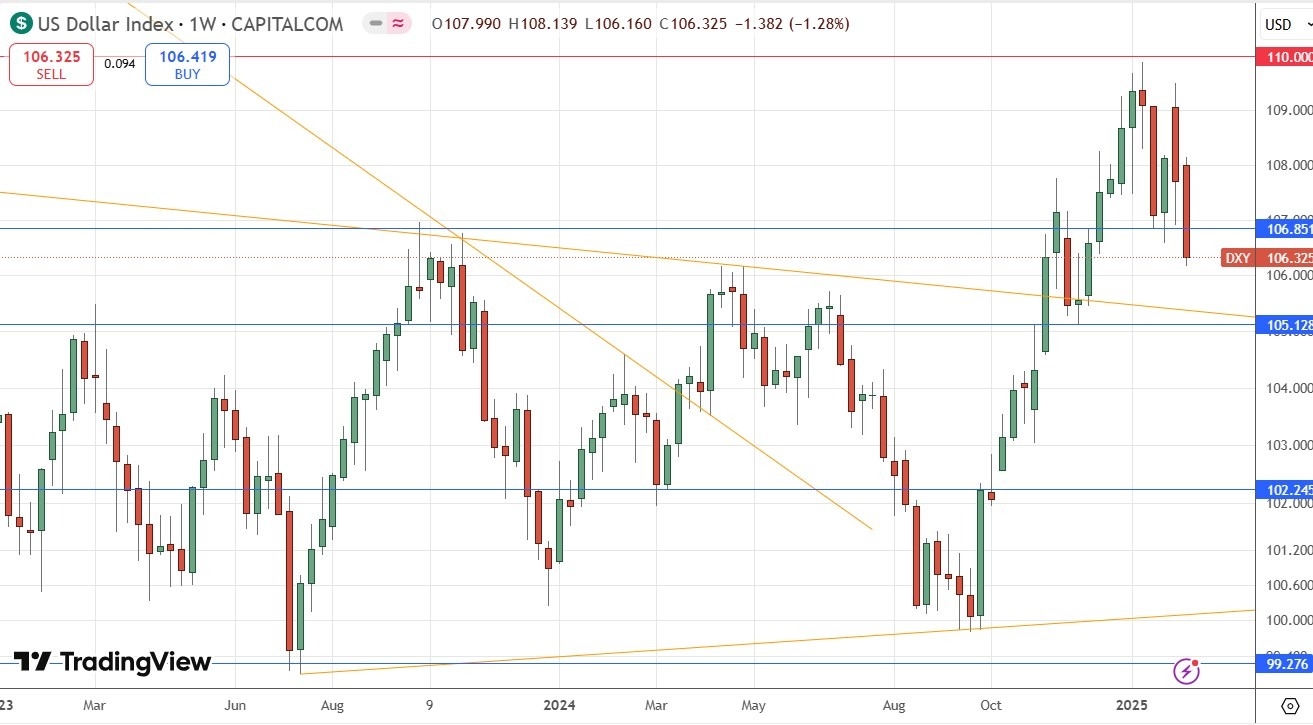
Last week, the US Dollar Index once again moved lower and invalidated the long-term bullish trend, after making a bearish reversal two weeks ago near the resistance level at 110.00. The most bearish sign is that the price finally broke below the nearest former support level at 106.85 on Thursday.
It seems clear that the dominant price action is bearish, while the long-term trend is mixed: the price is below its level of three months ago but above its level of six months ago. However, it looks increasingly as if this trend is over, despite new US tariffs and a more hawkish Fed which is still grappling with inflation that stubbornly remains above its 2% target.
The dollar is likely to continue falling over the coming week, although this is still technically counter to the current trend, so I would not rely on this forecast.
(Click on image to enlarge)
S&P 500 Index
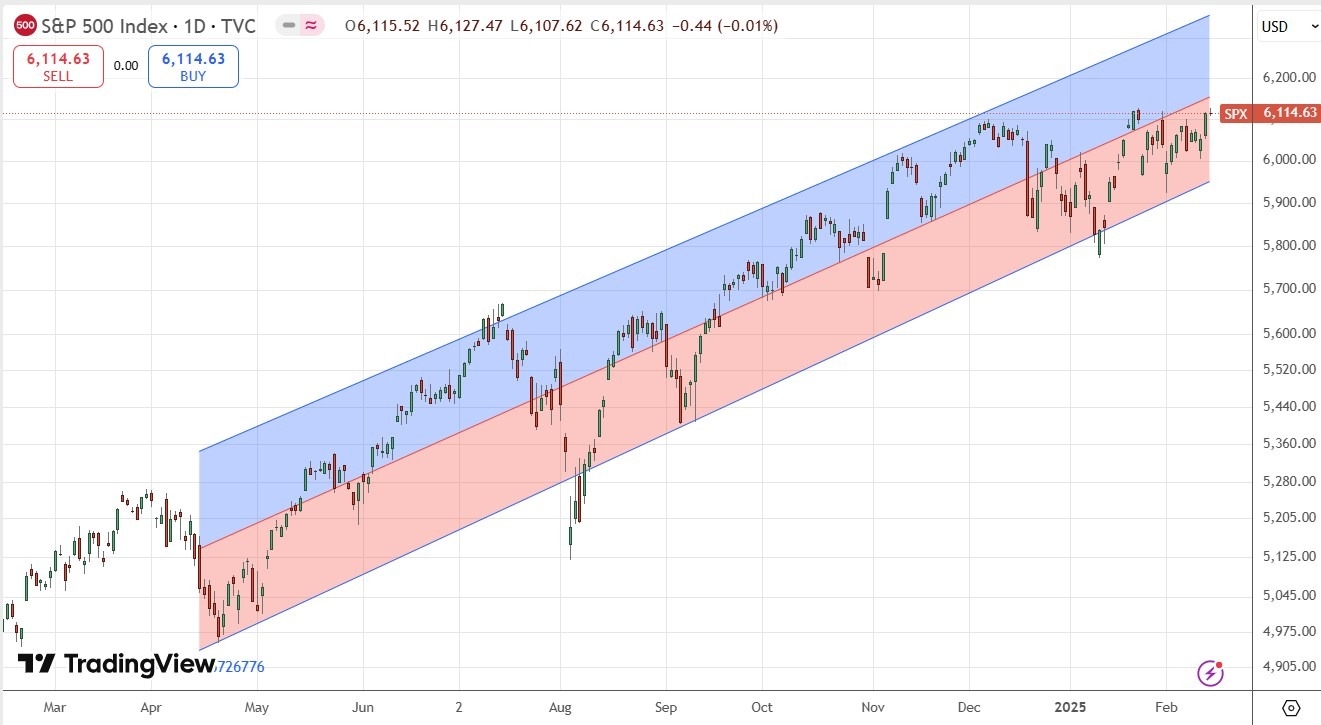
After making a new record high a few weeks ago, and then making a deep bearish retracement, the broad benchmark S&P 500 US stock index rose firmly last week to close not far from its record high. The weekly candlestick closed quite near its high, and the highest daily close which remains to be beaten is 6118.71. The price ended last week just a few points below that.
The recent increase in risk appetite has pushed this Index higher, and it looks close to a bullish breakout. I am very comfortable being long of the US stock market right now, so I think this looks like a buy if we get a daily close above the 6118.71 mark.
The linear regression analysis applied to the daily price chart below shows that the current bullish trend has been driving this market for almost two years, which is a relatively mature bull market.
(Click on image to enlarge)
Nasdaq 100 Index
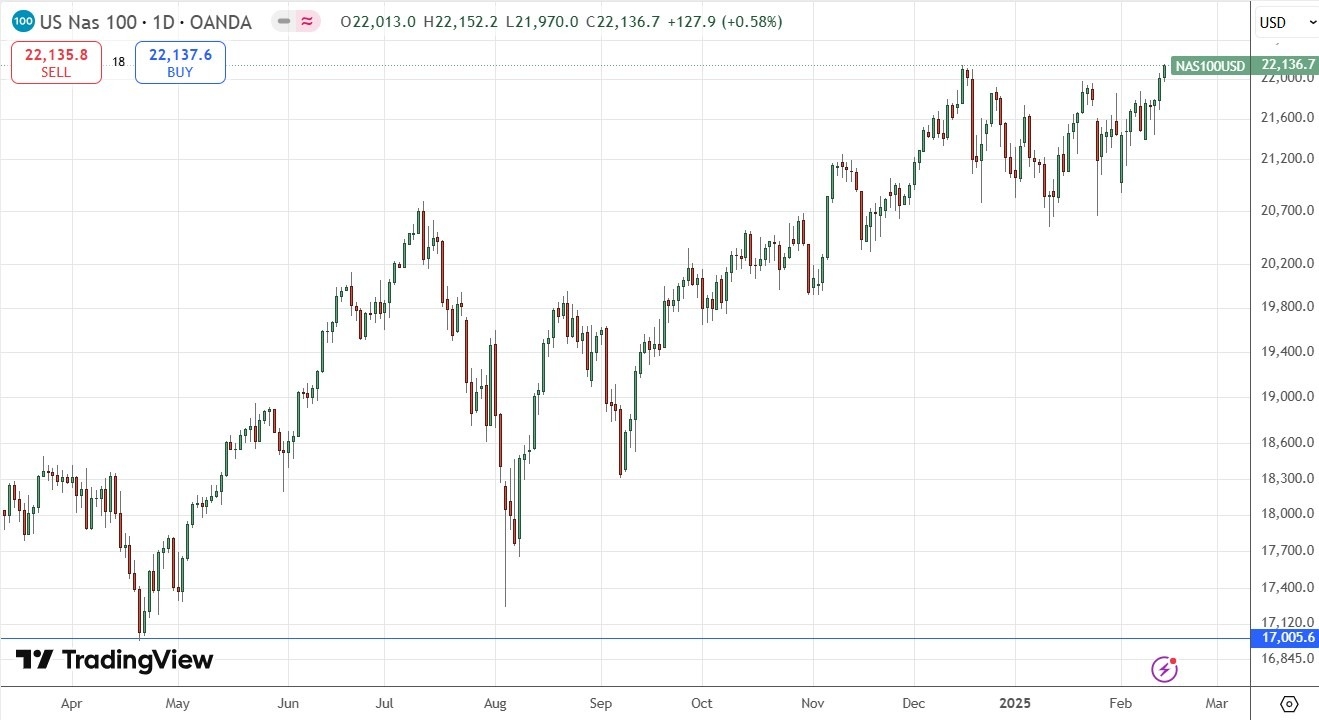
The price barely made a new record high on Friday after the recent bullish trend sent it higher. The price closed right on the high of its range. The Nasdaq 100 Index has been leading the S&P 500, as technology stocks usually do. These are all bullish signs.
I am very comfortable being long of the US stock market right now, so I think this looks like a buy at the moment, as we have already had a record high daily close -- plus the price traded Friday at a record high price.
Buying the Nasdaq 100 Index in strong bull markets has been an excellent trading strategy since it was created in 1985.
(Click on image to enlarge)
GBP/USD
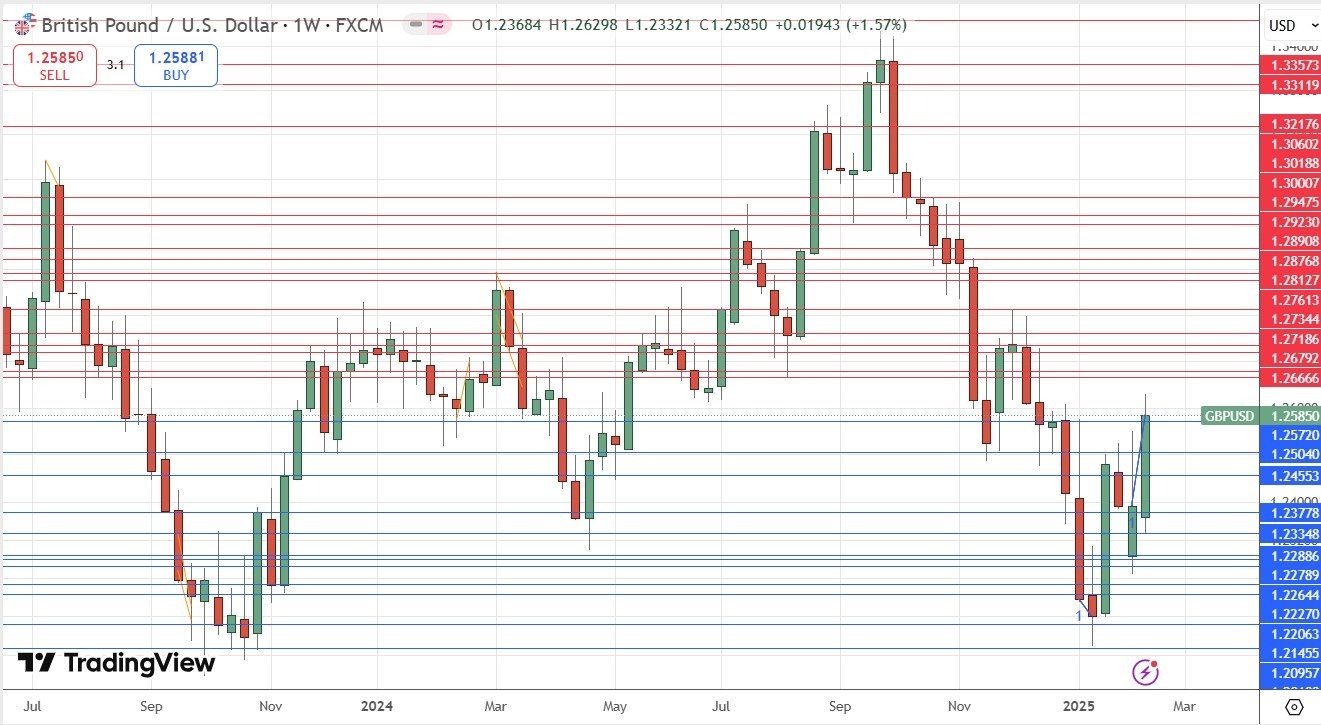
The GBP/USD currency pair printed a large bullish weekly candlestick, reaching its highest price since December 2024.
The British pound was one of the strongest major currencies over the trading week, partly because British economic data recently came in much higher than expected. This reduced expectations of forthcoming Bank of England rate cuts, which in turn boosted the pound.
On the other side, the US dollar was one of the weakest major currencies last week, so this allowed the buoyant pound to push the price considerably higher.
Despite the relatively bullish picture here, the price has not been trading in blue sky territory. I am not sure this analysis is very actionable, so I will not be trading this currency pair over the coming week.
(Click on image to enlarge)
XAU/USD
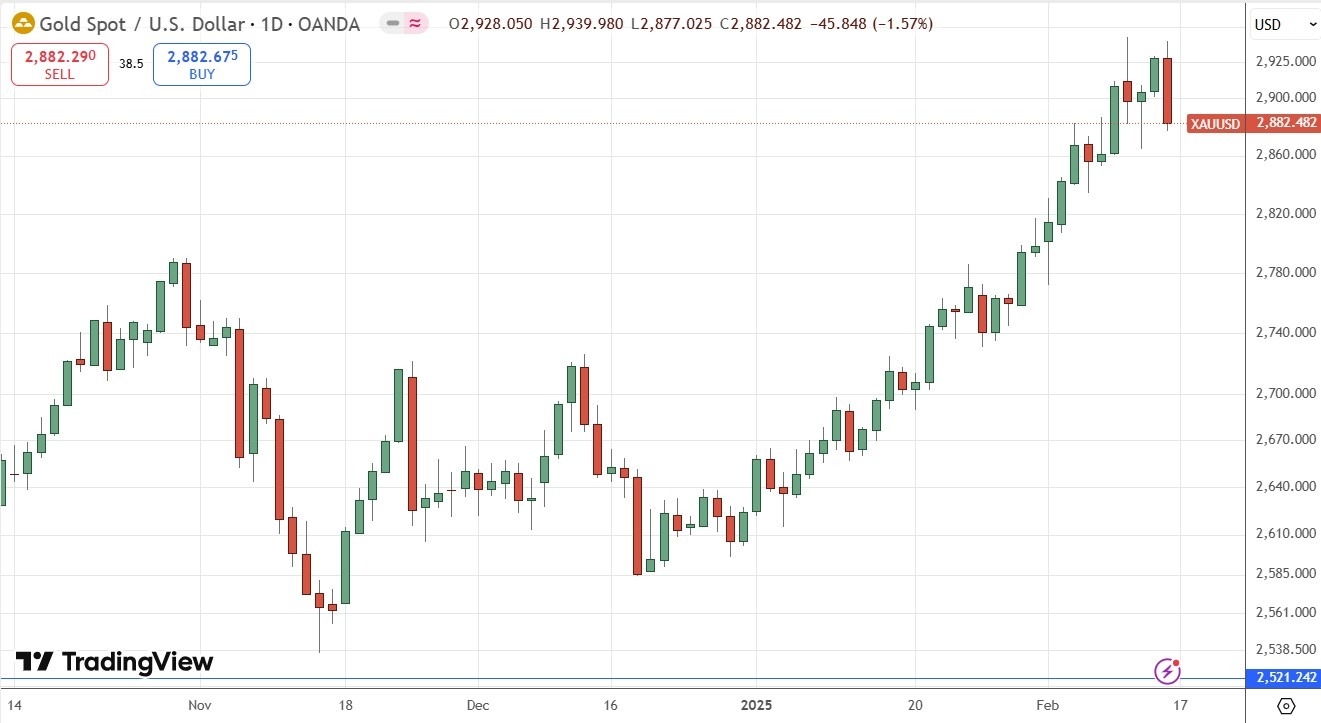
Gold advanced last Tuesday to reach a new all-time high above $2,942 per ounce. However, later in the week on Friday, the price gave back much of its earlier gain to close not far from the week’s open, which should be a factor of some caution to bulls. On the weekly chart, the recent price action looks close to a weekly bearish pin bar.
This trend may see a relatively slow rise, but we can see how steadily and strongly gold gained over the past year, so this looks likely to be a solid trend. I am far from sure that gold will reach $3,000 per ounce over the coming week, but this target is certainly in sight now.
Gold seems to be doing well in the current market environment, where both risky and safe-haven assets are performing well – and gold can play a role as both. As we saw a stronger bearish element creep in at the end of last week, I’d like to see a new record high daily closing price before entering any new long trade – specifically above the $2,926 mark.
(Click on image to enlarge)
Coffee Futures
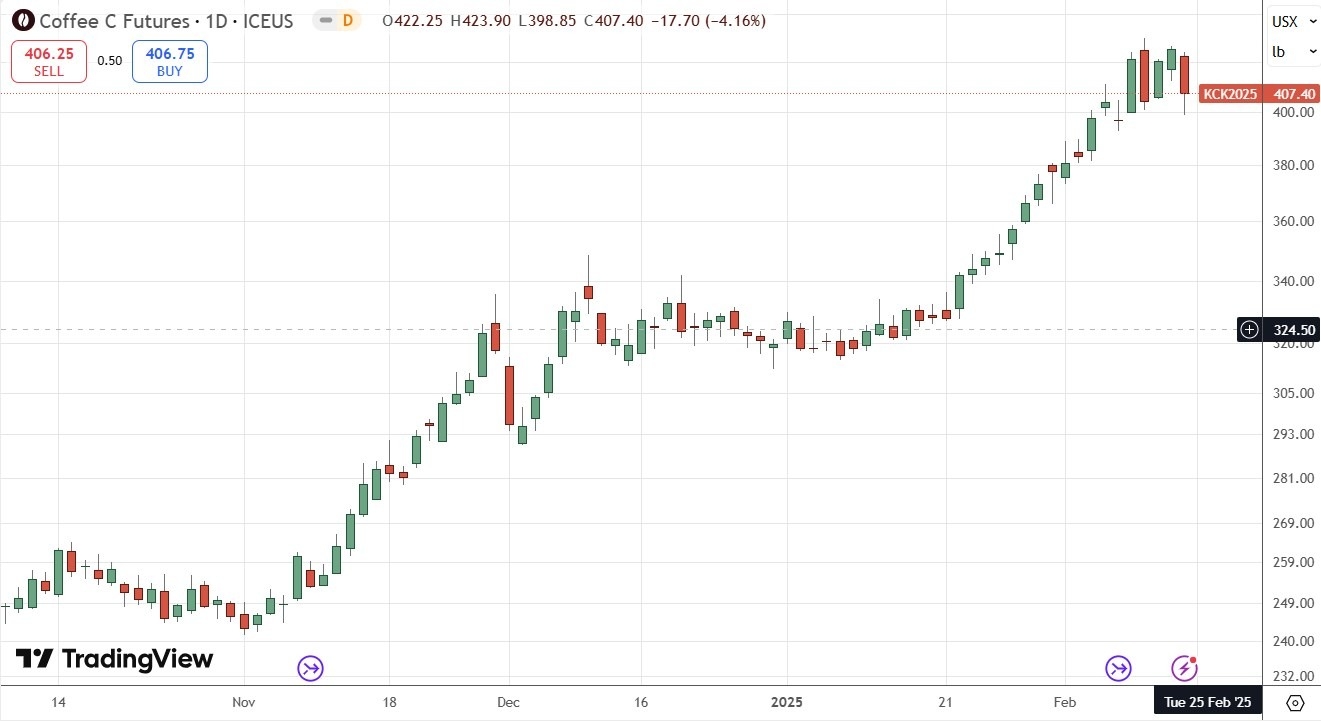
The price chart below shows that coffee futures have been breaking out to long-term high prices over a period of more than six months, with the recent price increases being relatively strong. We saw a new record high made last Tuesday, but the price action since then has been choppy and volatile.
Taking long trades when major commodities break out to new six-month highs has historically been a very profitable trading strategy, which is the main reason that I want to look for a long trade here.
Due to the choppiness, I want to see a closing price above the 425.10 figure before entering a new long trade. The recent higher volatility and swings up and down near the highs seem to be a sign that the bullish trend may be coming to an end.
Unfortunately, coffee futures are quite expensive and usually just too large for retail traders, but there is an ETF called COFF which can be used to participate in increases in the price of coffee. However, note that this ETF does not always cleanly mirror the price action of coffee futures, so if you are using the ETF, be careful.
(Click on image to enlarge)
Corn Futures
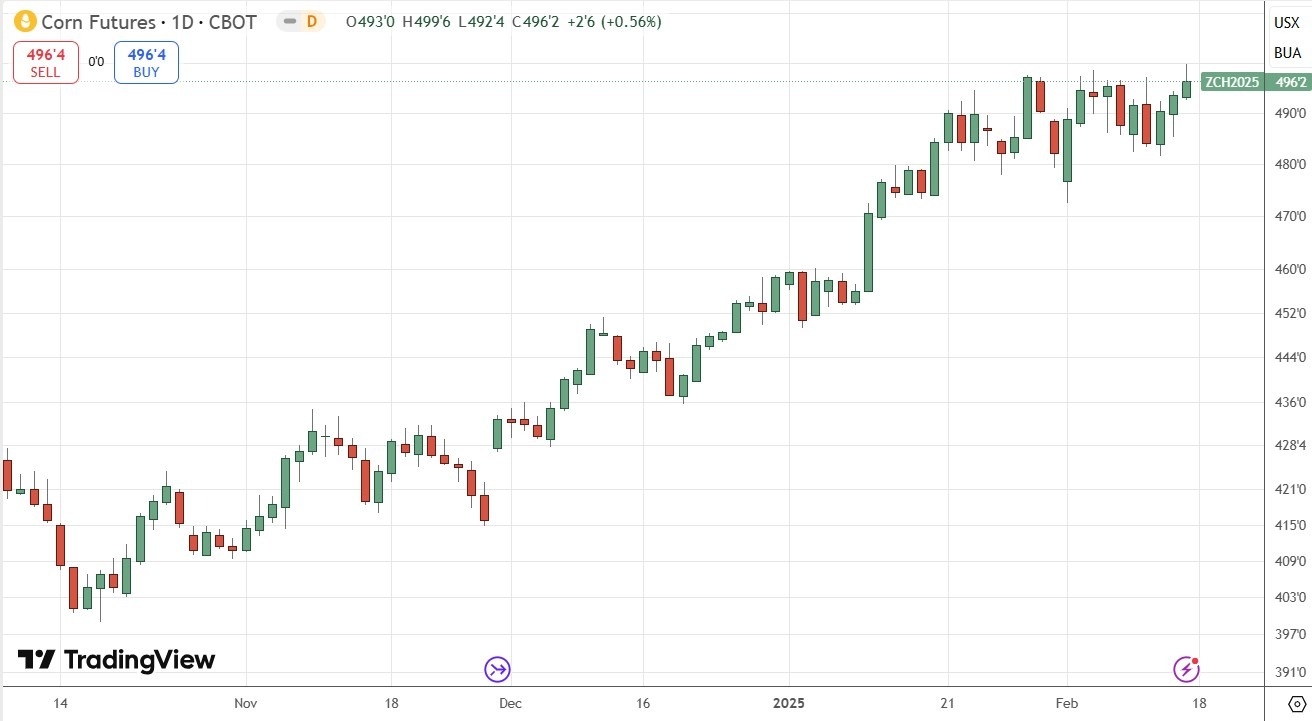
Corn futures have been breaking to new highs recently, with the price of corn trading at a new multi-month high price on Friday. The price action last week is the most bullish of any of the three major commodities which have recently made significant new high prices.
Many analysts may question the bullish trend here, seeing the jump in corn prices as an essentially seasonal development that is sure to end soon. This may be true, but I think when trading commodities it is better to be guided by the price than by your own preferred fundamental supply and demand scenario logic.
I think corn is a buy only if it makes a new daily high closing price, and this does look quite likely to happen as Friday’s close was just a whisker off of that. I will be prepared to enter a new long trade if we see corn futures make a new six-month high closing price at the end of any day over the coming week, specifically above the 498 mark.
(Click on image to enlarge)
Bottom Line
I see the best trading opportunities this week as the following:
- Long of the Nasdaq 100 Index.
- Long of the S&P 500 Index following a daily close above the 6118.71 level.
- Long of gold in US dollar terms (also known as the XAU/USD currency cross) following a daily close of spot gold above $2,926.
- Long of corn futures (the CORN ETF could also be used) following a daily close of the next ZC future at or above the 498 mark.
- Long of coffee futures (the COFF ETF could also be used) following a daily close of the next C future at or above the 425.10 figure.
More By This Author:
Forex Today: Risk Sentiment Improves On Russia Talks Despite Higher US InflationEUR/USD Forex Signal: Weakly Bullish Above $1.0338
Forex Today: Markets Expecting US Inflation Unchanged
Risk Disclaimer: DailyForex will not be held liable for any loss or damage resulting from reliance on the information contained within this website including market news, analysis, trading signals ...
more

