Volatility In External Demand
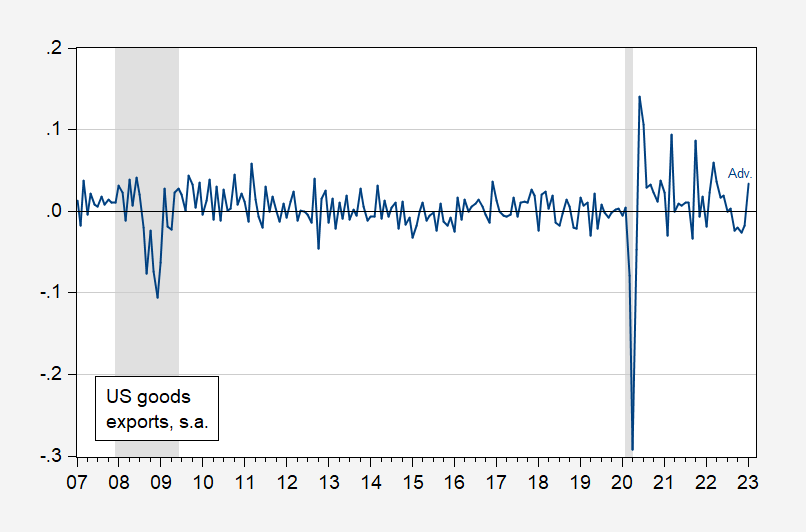
Advance estimate for January 2023 goods exports out today. A big jump, compared to the pre-pandemic past, but not compared to the recent past.
(Click on image to enlarge)

Figure 1: Month-on-month growth in US goods exports, seasonally adjusted (blue). NBER defined peak-to-trough recession dates shaded gray. Source: Census via FRED, NBER, and author’s calculations.
The standard deviation rises from 0.023 to 0.066 (2007M01-19M12, 20M01-23M01) Given the impact of the pandemic (as shown by the sharp drop in exports in 2022), it’s possible that some of the volatility is induced by the estimated seasonal factors. However, I suspect at least some of it is due to supply chain issues, and fluctuating demand overseas.
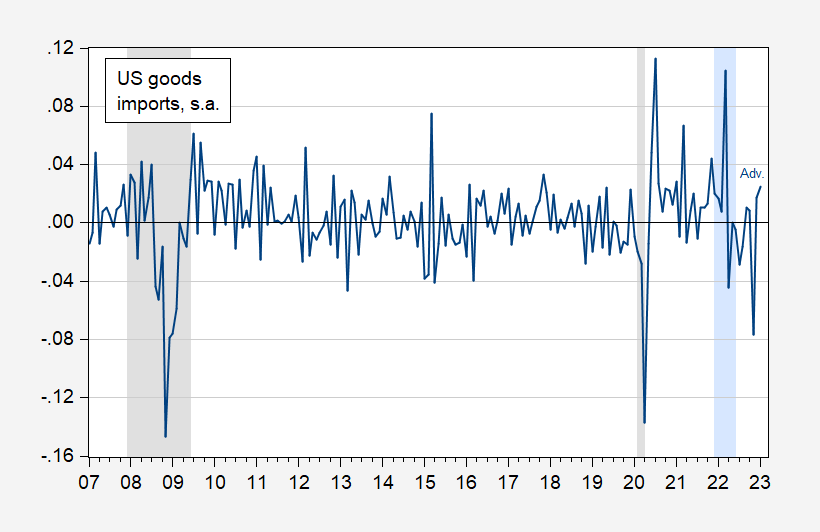
A similar pattern exists for imports.

Figure 2: Month-on-month growth in US goods imports, seasonally adjusted (blue). NBER defined peak-to-trough recession dates shaded gray. Light blue denotes a hypothesized 2022H1 recession. Source: Census via FRED, NBER, and author’s calculations.
The standard deviation rises from 0.026 to 0.043. Interestingly, while imports decline in 2022Q2, they do not fall anywhere near the decline in 2008 during the Global Financial Crisis, nor in 2020 during the pandemic. Of course, one has to be careful about interpreting imports as completely demand-driven given supply chain constraints including production disruptions in China and elsewhere (the typical approach to estimating imports of goods into America during “normal” times is to assume supply is elastic).
More By This Author:
PCE Inflation – Headline, Core, Trimmed Month-On-Month And Instantaneous
Dealing With Seasonality With 12 Month Changes: The QCEW
Employment Levels And Cumulative Changes: Tales From The QCEW


