
Tuesday Talk: Higher And Higher, Baby
Stocks on Wall Street started the week moving even higher. The S&P 500 closed at 4,385, up 15 points, the Nasdaq Composite closed at 14,733, up 32 points, and the Dow Jones Industrial Average closed up 126 points, at 34,996. Or to show it another way 35,000 (I know, this isn't horseshoes)!

The most actives on Monday were big name Blue Chip and Technology stocks as you can see from the chart below:
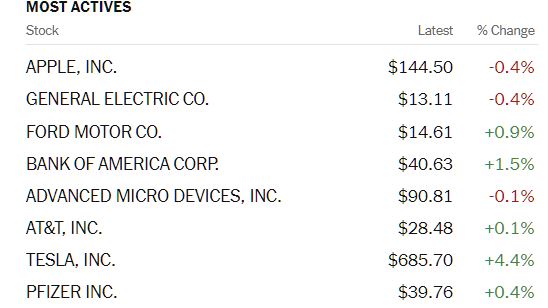
Chart: The New York Times
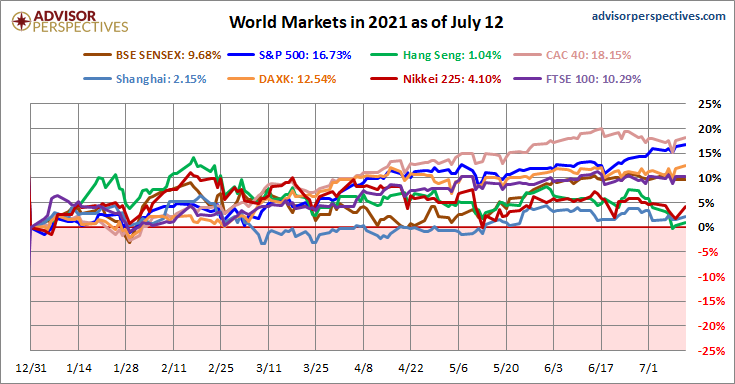
So year to date, you might be asking just how high in the clouds are the markets? TalkMarkets contributor Jill Mislinski in her World Markets Update - Monday, July 12 answers exactly that question.
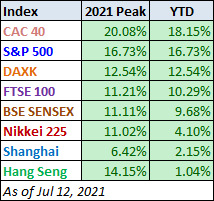
"All eight indexes on our world watch list posted gains through July 12, 2021. The top performer is France's CAC 40 with a gain of 18.15%, our own S&P 500 is in second is with a gain of 16.73% and Germany's DAXK in third with a gain of 12.54%. Coming in last is Hong Kong's Hang Seng with a gain of 1.04%...though, Shanghai has fared the worst thus far (since the start of the worldwide COVID recession in Feb 2020) as recovery from the COVID-19 pandemic continues."
Mislinski gathers the data for all eight world indexes YTD in the graph and table below:
See the full article for additional charts and comparative historical data.
TM contributor, economist Menzie Chinn in his article The WSJ July Survey Of Economists – CPI And GDP Forecasts says the overall responses to the survey are positive. The article is a solid set of graphs as only economists can draw. Below are Chinn's intro comments and one of his graphs:
"The forecasted price level (CPI) has been moved up, as near-term expected inflation has increased. Near-term GDP growth forecasts upwardly revised, but downside risks remain. Projected output gap small positive at year’s end."
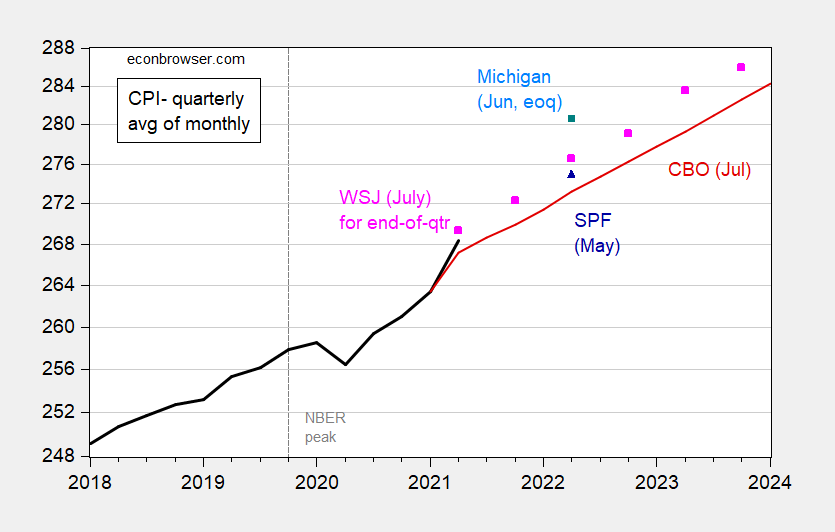
"Figure 1: CPI – all urban, quarterly average of monthly data (black bold), CBO projection (red), WSJ July survey mean for end-of-quarter (pink), Michigan survey of consumers for end-of-quarter (blue square), Survey of Professional Forecasters median (blue triangle).Q2 CPI actual and Michigan survey implied level for June 2022 uses Bloomberg consensus for June 2021 CPI as of 7/12. NBER peak at dashed line. Source: BLS via FRED, WSJ July survey, Michigan survey of consumers, SPF/Philadelphia Fed, Bloomberg as of 7/12, and author’s calculations."
Contributor and chartist Declan Fallon in Markets Edge A Little Higher, But Larger Picture Unchanged has this to say about Monday's action:
On the Nasdaq: "We are still seeing most of the leg work been done by Large Cap stocks while Small Caps remain caught within their base. Trading volume was below Friday's selling, and only the Nasdaq had action of note as today's doji left it bang-on the bearish black candlestick of last week; any gain tomorrow will negate this bearish candlestick." (NDX, COMP)
WRT the S&P: "The S&P added a little more as it marked a new all-time high, although the rate of relative (out-)performance against the Russell 2000 slowed." (SPX)
Regarding the Russell: "The Russell 2000 closed above its 50-day MA, but moving averages are of less importance during a basing pattern. Trading volume was very light and with vacation season fast approaching it's unlikely to pick up with sufficient momentum to sustain a rally." (IWM)
Summation: "We have markets diven by Large Cap leadership, but still needing Small Cap participation to give it any kind of sustainability. If this Covid rally fails we could see markets moving back through Fibonacci levels."
Go to the article for the charts.
Martin Armstrong runs through Monday's action by geography, Energy and Bonds in Market Talk - Monday, July 12. Here are his comments on the drivers in the UK 🇬🇧 markets:
"Britain’s post-lockdown economic rebound slowed sharply in May despite a relaxation of social-distancing rules, according to official data. Gross domestic product expanded by a monthly 0.8%, much faster than its typical pre-pandemic pace but down from April’s 2.0% surge. It was also a lot weaker than the median forecast of 1.5% in a Reuters poll of economists. The Bank of England expects Britain’s economy to grow by 7.25% this year, the fastest since 1941. Last year output plunged by almost 10%, the biggest drop in more than 300 years. Britain’s dominant services sector grew by a weaker-than-expected 0.9% in May from April as a huge 37.1% monthly jump for accommodation and food services failed to offset slower increases elsewhere in the sector."
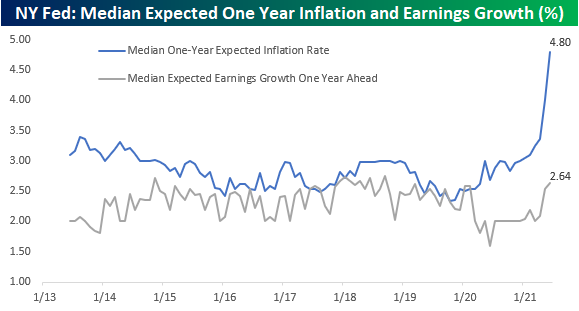
The Staff at Bespoke Investment group, another TalkMarkets contributor, review the results of the latest Survey of Consumer Expectations (SCE) released by the New York Fed, yesterday. Among the charts is the one above showing the sentiment delta between earnings growth and inflation.
"In each month’s survey, respondents are also asked for their expected rate of earnings growth over the next twelve months. In this case, there’s a pretty big divergence between expected inflation (4.8%) and expected earnings growth (2.64%). In fact, the spread between the two has now widened out to a record 2.16 percentage points. There’s only so long that inflation can grow at nearly twice the rate of earnings growth."
Food for thought.
In their article Dow Scores Record Close, Eyes 35,000 Level, the Staff at Schaeffer's Research made these observations concerning yesterday's rises in the indices:
"The Dow kicked off expiration week with a second-straight triple-digit win and record close, though it ultimately fell just short of the psychologically significant 35,000 level in the last hour of trading. The S&P 500 and Nasdaq joined the blue-chip index in the black as well, scoring record closes of their own to wrap up the session. The imminent earnings season was on the forefront of investors' minds today, while a Capitol Hill testimony from Fed Chair Jerome Powell will surely pique Wall Street's interest later this week." (DIA)
Tuesday action awaits.

In a TalkMarkets Editor's choice column, contributor Korbinian Koller takes a deep dive into Bitcoin (BITCOMP) trading and offers some advice to some possibly, (currently) despondent investors. His article Bitcoin, Stay On Course is worth a peek, especially for the cryptoasset invested among us. Here is some of what he has to say:
"Don’t let Bitcoin get away, it has a high probability to take off soon
Bitcoin is going through a rough patch of building a bottom. When inherently volatile Bitcoin gets squeezed into tight sideways ranges, low-risk entry points get harder to execute. Over time, there is no directional follow-through, and a trader’s confidence gets weary. Typically, this leads to a low probability of being exposed to the final push-through move. One quickly can accumulate losing trades now trying to chase or otherwise catch a trade with a different than usual entry approach."
"Anything is possible: No one knows the future, but we know that Bitcoin is a highly cyclical and seasonal trading vehicle. It would be nothing less than foolish to rule out Bitcoin moving quickly again."
"Bitcoin, stay on course:
We recommend not to experiment with a different approach to the markets when you are in a rut. Never follow other people’s recommendations as a reason for making a trade. Use principles only as reasons to stack your edges. Follow as close as possible a prefabricated plan you made for executing your trades to be emotionally uninfluenced by surprising market behavior in real-time. When in doubt, stay out is also a term that comes to mind, and it is undoubtedly always a good decision to reduce position size when unexpected losing trades make you feel uneasy. Use any methods to keep your confidence and coolness to accept the risks when exposing your money to the market."

With 2H21 out of the gate at what one can only call a "heady" pace, Jane and Jack investors are looking for places to place their bets. Contributor Zacks Equity Research in their article 4 Mutual Fund Picks To Play The Hot Themes Of 2H21 has these possible suggestions:
But first, regarding mutual funds: "Why should investors consider mutual funds? Reduced transaction costs and diversification of portfolio without several commission charges that are associated with stock purchases are primarily why one should be parking money in mutual funds."
"Fidelity Select Utilities Portfolio (FSUTX) aims for capital appreciation. This non-diversified fund invests majority of assets in common stocks of companies primarily engaged in the utilities industry and companies generating most of their revenues from utility operations...Utilities has a history of positive total returns for more than 10 years. Specifically, FSUTX has returned 9.6% and 10.3% in the past three and five-year period, respectively.
Fidelity Select Technology Portfolio (FSPTX) fund aims for capital appreciation. It invests primarily in equity securities, especially common stocks of companies that are engaged in offering, using, or developing products, processes, or services that will provide or will benefit significantly from technological advances and improvements...Tech product has a history of positive total returns for more than 10 years. Specifically, this non-diversified fund has returned 27.9% and 31.1% in the past three and five years, respectively. FSPTX has an annual expense ratio of 0.69% versus the category average of 1.04%.
Franklin DynaTech Fund Class A (FKDNX) aims for capital appreciation. The fund invests in common stocks of companies that its managers believes are leaders in innovation, have superior management, and benefit from new industry conditions in a dynamically changing global economy...FKDNX has three and five-year annualized return of 25.5% and 26.5%, respectively. FKDNX has an annual expense ratio of 0.85%, which is below the category average of 0.99%.
New Alternatives Fund Class A (NALFX) seeks long-term capital growth with income as its secondary objective. It primarily invests in common stocks of companies and even in other equity securities such as real estate investment trusts and American Depository Receipts...(The Zacks) Other Product sector has a history of positive total returns for more than 10 years. Specifically, NALFX has three and five-year returns of 29.4% and 20.8%, respectively. NALFX has an annual expense ratio of 0.96% compared to the category average of 1.26%."
As always, caveat emptor.
That's a wrap. Many readers will remember the 1976 Electric Light Orchestra hit "Livin' Thing". The first stanza and refrain go like this:
"Sailin' away on the crest of a wave, it's like magic
Oh, rollin' and ridin' and slippin' and slidin', it's magic
And you and your sweet desire
You took me, oh (higher and higher, baby)
It's a livin' thing
It's a terrible thing to lose
It's a givin' thing
What a terrible thing to lose"
Give a listen and have a good week!


