
The stock market continued its post FOMC rate hike climb in the run-up to today's mid-terms. Perhaps fueled by the prospect of a Powell pivot post election, the Dow soared on Monday.

Nearly touching 33,000 the DJIA closed at 32,827, up 424 points. The S&P 500 closed at 3,807, up 36 points and the Nasdaq Composite closed at 10,565, up 89 points. In Asian markets the Nikkei was up 344 points and the Hang Seng was down 39 points. In morning trading today both the FTSE and the Dax started down, slightly.
In morning futures trading S&P 500 market futures are trading up 3 points, Dow market futures are trading up 37 points and Nasdaq 100 futures are trading up 32 points.
Contributor Tim Fries writes as follows: S&P 500 Usually Rallies After US Midterms, But Could Things Be Different This Time?
"...As market correlations go, the one between midterm elections and stock performance is a sound one. Representing the stock market as a whole, the S&P 500 index had the best average returns in midterm years. For the past 10 years, in particular, November has been the best month of the year for stock gains."

Since 1950, the average S&P 500 return is ~15%, without negative years. Image credit: @RyanDetrick
"...This time, due to the cost of living skyrocketing since President Biden took office, the market expectation is on the Republican side. For instance, the Reuters/Ipsos poll conducted on November 1st showed that only 18% of Americans think the country is going in the right direction, with 69% disapproving...Tomorrow, on November 8th, such polling numbers will likely rearrange Congress and Senate seats in Republican favor. However, if there is an R/D split between the House and Senate, a resulting government gridlock may be the most favorable position for markets. After all, neutralizing major policies would also neutralize their market impact, for better or worse."

Stronger dollar reflects tightened liquidity, exacerbating capital costs and suppressing stocks. Image credit: Trading View
"For this midterm election to join the historical trend, the market would then have to ignore the fastest rate hike cycle in 40 years. Yet, the Fed became even more hawkish after the last FOMC meeting, resulting in the 4th 75 bps hike increase. Specifically, Fed Chair Jerome Powell said that the central bank’s monetary tools tackle recession better than entrenched inflation.
“If we overtighten, we can use monetary policy tools to support the economy but if we don’t tighten enough inflation becomes entrenched.”
Unless the next CPI report on November 10th shows drastic, unexpected improvement, the Fed will continue to suppress the markets with more hikes. In this light, it is not a question of whether this midterm season will spike market performance, but which stocks perform better in a recessionary environment."
See the full article for further reflections and some interesting post-election stock picks.
TM contributor Bill Kort has some advice for those Having Trouble Making Sense Out Of The Market?
Bill summarizes the situation as follows:
"It’s all about the history you don’t know
— We have been this way before, and rates and inflation were much worse
— Historic fact does not matter … pessimism reigns supreme.
— Blood in the streets + horrible sentiment + attractive valuation = Time to be greedy"

"History would indicate that the 1970s were much worse yet, as inflation raged the stock market did just fine.
|
1974 |
1980 |
|
|
CPI inflation (annualized) |
11.04% |
13.58% |
|
10-yr UST yield: 1/1/1975-1/1/1981 |
7.5% |
12.57%* |
|
S&P 500: 1/1/1975-1/1/1981 |
72.56 |
133 (+83%)** |
|
* The All-time high yield on the 10-yr. UST note was 15.82% (September 1981) |
||
|
** The actual peak for the S&P 500 was 141.54 11/28/1980. The subsequent bear market low occurred 451 days later (2/22/1982) at 111.59, -20.59%. (Forbes.com) |
Today the trailing 12 month number on CPI inflation is 8.2%
The yield on the 10 year US Treasury note is 4.2% The S&P 500 is 3752.75
Yes, inflation is high in relation to the 2% level we have enjoyed over the past couple of decades. This would seem to mark a secular change signaling the end to globalization. That 2% rate came at a price … jobs lost to inexpensive overseas labor and stagnant wage growth for our long-suffering middle class. It should moderate over time but don’t expect it back at 2% unless we have a complete economic collapse. My sense is that Mr. Powell will moderate his stance long before that happens...
The tech and innovation stocks (this generation’s one-decision stocks/”nifty fifty”) have been particularly hard hit. The group had run to extreme valuations. They were the cure-all during the early days of the pandemic vs. those companies considered sensitive to the economy, which had been shut down. They have imploded as the Fed has been raising rates to fight inflation.
As to the blood in the streets, the music stopped November 22, 2021. … Nasdaq since then is down 31 %, the Ark Innovation Fund (ARKK), the poster child for “all tech, all the time” was down nearly 80% at its low.
Interestingly the stodgy old (tech-lite) Dow is only down about 10% from the 52-week high it hit January 5, 2022...
Valuations are pretty attractive with FAANGM: Meta (META), Apple (AAPL), Amazon (AMZN), Netflix (NFLX), Google/Alphabet (GOOGL) and Microsoft (MSFT)] stocks = 20% of S&P 500 market capitalization (at peak 24%)*
The forward PE on the S&P 500 at 15.5. Ex FAANGM =15.1*
19.4 is the latest fifty year average PE**…1900-1980 the average was 13.4***
Again, the Forward PE on the S&P 500 is at 15.5, while the S&P 400 (mid-cap) and S&P 600 (small-cap) rest at 11.2 and 10.8 respectively.*
After similar love affairs with high tech and High PE stocks in the “Nifty Fifty” era of the 1970s and the Tech “Bubble” of Y2K mid-cap and small cap stocks that languished during the period of tech domination took off."
Perhaps a juicy take from Mr. Kort, but readers, as always Caveat Emptor.
Contributor Bob Lang is vexed by the Vix as he asks in his column, What Is Going On Between Price And Volatility?
"One thing my fellow traders and I have noticed over the past few months is a lack of response from the VIX (volatility indicator) when markets move sharply higher or lower. Normally, volatility leads to price, which is why the VIX is such an important indicator. Instead, it has barely moved when the markets soar or get drilled. So what is going on between price and volatility right now?
Some traders believe the VIX isn’t working. Of course, that could not be further from the truth...

The VIX tells us a great deal of information about what is happening at the moment, and it seems two things are happening.
First, traders who wanted index puts as portfolio protection already hold them, so there is no demand for volatility in the VIX or SPX options.
Second, the economy seems to be heading toward a slowdown with higher rates, quantitative tightening, and continued inflation. Traders already know this. The VIX rises when the markets and/or the economy are hit with a shock and adjustments need to be made to portfolios.
Hence, volatility in the markets is not leading stock prices right now.
Compare today to 2020 when the consequences of the Covid-19 pandemic were first being analyzed. A doomsday scenario was being quickly priced in as capital fled the markets and stock prices crashed. After calmer heads prevailed and a slew of liquidity came into the market, volatility was removed and the markets rebounded.
With today’s VIX movement vs stock price action and what we know, the stock market is not set up to crash in the near term (unless a black swan event arrives). However, that doesn’t mean stocks won’t go lower. When prices do fall, rising up will be that much more difficult as lower ranges will be the norm."
Stepping onto slightly firmer ground Jack Scoville checks in with the current Softs Report (soft commodities).
Here's the news in brief:
"Cotton: Cotton was sharply higher on Friday and up for the week on ideas of improving demand. There are reports of increased price fixing by mills and hopes that China is about to open again despite its zero-tolerance Covid policies. Chinese demand is especially a problem (lockdown related). Trends are now mixed on the charts. Production in the US is very short."

Photo by Kolya Korzh on Unsplash
FCOJ: FCOJ was higher again Friday and made new contract highs. The market has been holding firm on supply-side fundamentals. USDA estimated Florida production at 28 million boxes in its latest production reports and these are historically low estimates of production. Weather remains generally good for production around the world save for Florida where storm damage is expected to be very big, with many trees lost as well as fruit lost.
Coffee: New York and London closed higher on Friday and for the week. Ideas that the market remains short of Coffee for nearby needs are still around and are shown in the spreads. Ideas are that the market will have enough Coffee when the next harvest comes in a few months. The spreads in New York are bullish, implying that supplies are less than demand for right now and that prices should be higher.
Sugar: New York and London closed higher on Friday and for the week last week on ideas of tight current supplies...More ideas that supplies of White Sugar would soon be increasing for the market could limit the upside for the London market. However, Brazilian truckers are unhappy that Lula won the presidency again and are taking action to block transport inside of Brazil. In fact, the world Sugar market is expected to be in a big surplus production next year. Ideas of a world surplus in the coming year are hurting the prices in both markets, but supply remains tight for now.
Cocoa: New York and London closed higher last week and London made new contract highs. Trends remain up in both markets. The grind reports were released in the last two weeks and showed strong demand. Good production is reported and traders are worried about the world economy moving forward and how that could affect demand. Supplies of Cocoa are as large as they will be now for the rest of the marketing year.
Read the full article for weather reports and more detailed observations.
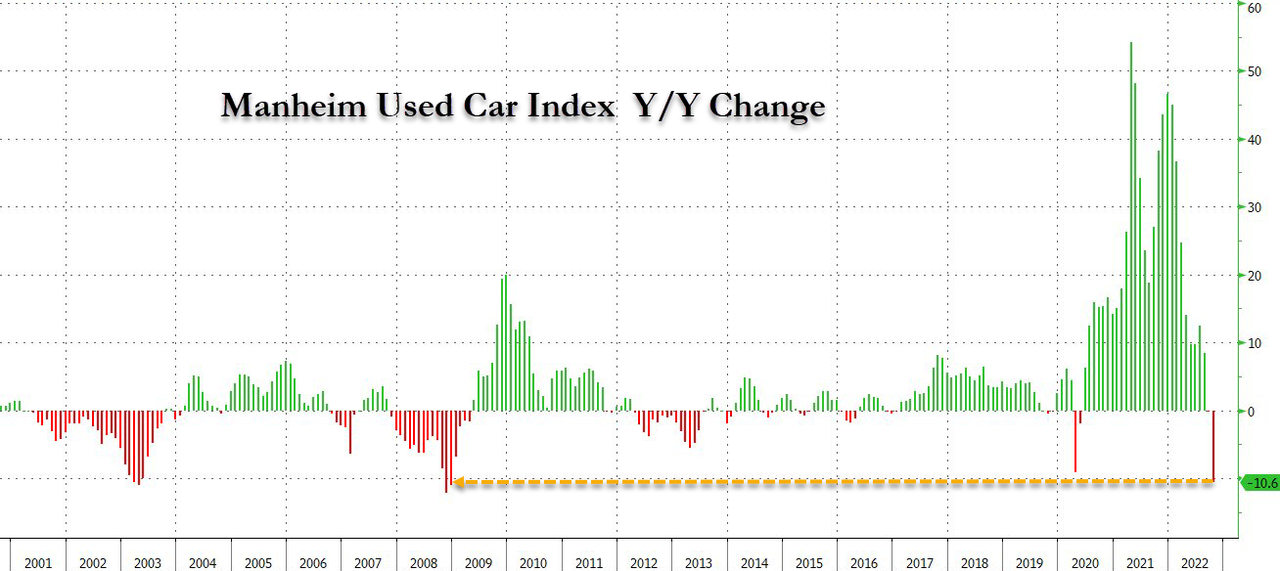
Remember in 2021 in the midst of the worldwide supply-chain logjam when new cars where hard to come by and prices of used cars went sky-high? Well, TalkMarkets contributor Tyler Durden reports that with supply-chain problems largely solved; Used-Car Prices Collapse The Most Since Lehman Meltdown.
Here are some excerpts and charts from his article.
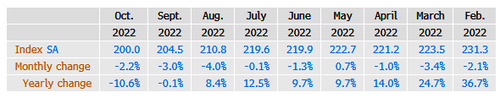
"With soaring borrowing costs, the Federal Reserve has slammed the brakes on the once-booming used car market...The Manheim Used Vehicle Value Index for October declined to 200, or about 10.6%, the worst decline since December 2008 when the global economy was melting down (and the 5th largest decline ever).
"Edmunds data showed the average annual percentage rate on used-car loans was a staggering 10% for some borrowers."
"The index that tracks the price of what car dealerships pay at auto auctions has slid for 8 of the nine months and declined for the 5th straight month.
Since the Fed hasn't blinked (yet) and borrowing costs continue to skyrocket, wholesale used-vehicle prices could cool significantly more.

The slump in wholesale used-vehicle prices could be a harbinger of when the Fed begins to hike interest rates at a slower pace.
"Used car prices, once considered the barometer of how bad inflation has become, are now moderating. In fact, they have been dropping for a year. As supply-chain shortages moderate, this closely-watched gauge will likely continue to decline, helping curb overall inflation. The move may also support the narrative that the Fed can scale back its rate increases, boosting stocks," Bloomberg's MLIV Vincent Cignarella wrote...
The bad news about sliding wholesale used-vehicle prices is when they crush the retail market, there will be so many new buyers underwater in their vehicle loans."
"Meanwhile, shares of Carvana (CVNA) crashed 24% Monday after the company missed Wall Street's top- and bottom-line expectations for the third quarter as the demand for used cars plummeted. Last month, the largest US chain of car dealerships, AutoNation (AN), whose CEO, Mike Manley, warned the used car market showed signs of imploding. Separately, Hertz Global Holdings (HTZ) reported its third-quarter earnings that showed depreciation costs were rising due to its used car prices at auction fetching lower values."
That's a wrap for today.
If you need a motivational reminder about voting, here's one from Binky and Baxter!
More By This Author:
TalkMarkets Image Library
Tuesday Talk: Election Market a
Thoughts For Thursday: Looking For Honey, Bear Rally Continues


Comments
Log in or sign up to join the conversation.