Thoughts For Thursday: Looking For Honey, Bear Rally Continues
The stock market has been in a bear rally since last week and while that may be sweet it is also not without risk as seen by the spilling of the Nasdaq honey pot yesterday as earnings and forecasts for both Microsoft and Alphabet disappointed investors. Apple reports today and is expected to deliver higher year over year fiscal Q4 results, with a cautionary forecast for holiday season sales.

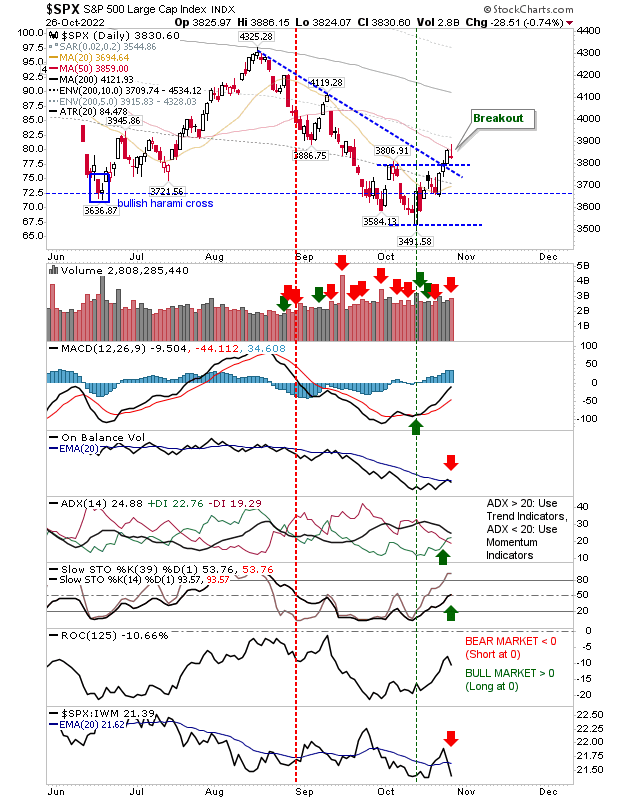
The S&P 500 closed at 3,831 yesterday, down 29 points. The Dow Jones Industrial Average closed at 31,839 up 2.37 points, while the Nasdaq Composite closed at 10,971, down 228 points.
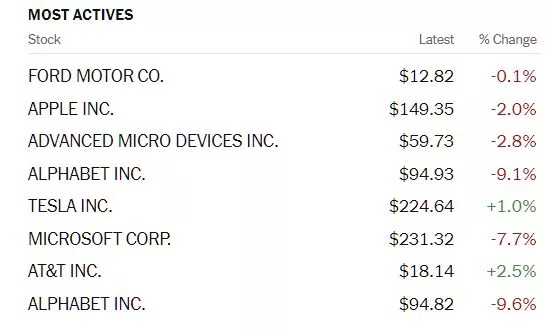
Most actives were all tech stocks, save for Ford (F) and AT&T (T) which are both closely tied to tech. Both Microsoft (MSFT) and Alphabet (GOOGL) were well pummeled.

Currently morning futures are mixed. S&P 500 market futures are up 2 points, Dow market futures are up 208 points and Nasdaq 100 market futures are down 58 points.
TalkMarkets contributor and chartist Declan Fallon says the S&P Breakout Holds Despite 'Gravestone' Doji
"It was a mixed day. Much of what happened started positively, but by the close of business, indices were back where they started the day.
The S&P 'gravestone' doji could be considered a bearish 'harami cross', with stochastics [39,1] on the mid-line and standard [14,3] stochastics overbought. if this proves to be true (and bearish 'harami crosses' tend to be reliable reversal patterns), then Thursday will be a down day. Add to this, On-Balance-Volume has returned to a 'sell' trigger, with a sharp loss in relative performance to the S&P."

"The Russell 2000 ($IWM) is the most bullish index with technicals net bullish. However, it couldn't escape the bearish `gravestone doji` either, which tagged its 50-day MA. If sellers do make an appearance Thursday it will quickly encounter support. I don't expect sellers to dominate as there has been a marked shift in favor of accumulation but let's see what the market delivers."

"If there is a bearish reversal to happen, then look to the Dow Industrial Average. It has banked the most gains since the October double bottom, but the bearish 'inverse hammer' on overbought stochastics offers bears the best chance to profit from a short trade."
Contributor Michael Kramer writes Stocks Drop As The Bear Rises Ahead Of The ECB And US GDP.
"Stocks finished the day lower despite falling rates and a weaker dollar. Earnings were the primary driver. Strange to write that. Macro forces have dictated the market for so long that sometimes you can forget that the market can move on fundamentals.
Tomorrow we have the ECB, GDP, and inflation data. I tend to think that the inflation readings, like the GDP price index, will be hotter than expected, while the ECB is likely to be non-committal to future rate hikes."
Turning to particular stocks Kramer minces no words as regards Meta (META), (old Facebook feelings to the side).
"Meta continues to drop, as it has now fallen below support at $114. I guess after $108; the stock could get to $90. In terms of the business, I haven’t liked Meta and never ever have."

Speaking of Meta, contributor Greg Feirman notes that Zuck Goes All In On The Metaverse.
"With his stock down ~70% from its all-time highs as its core business – Facebook and Instagram – matures CEO Mark Zuckerberg is making an All In bet on the Metaverse.
Let’s start with the core business. Daily Active Users (DAUs) have clearly reached some sort of saturation point. They inched up to 1.98 billion in 3Q22 from 1.97 billion in 2Q22 – and this has been the case for many consecutive quarters now. As a result revenue growth has actually turned negative the last two quarters clocking in at -4% in 3Q22. And that isn’t going to change next quarter with META guiding 4Q22 revenue growth to -9%. Operating income, net income, and EPS were chopped in half in 3Q22 compared to a year ago.
META’s total expenses in 2021 were $71 billion. In 2022 they are expected to be $85-$87 billion. And 2023? META is guiding them to $96-$101 billion. To put that in perspective META’s 2022 revenue is expected to be $115 billion. In other words if revenue is flat in 2023 operating income will be down two-thirds from $47 billion in 2021."
Despite have $42 billion in cash and securities on their balance sheet, Feirman wonders if Mark Zuckerman isn't betting the farm. I think he is and he best bring on some strong farm hands to help see him through to the income producing side of the metaverse.

A continued strong dollar is causing gold to continue to move lower according to contributor Kelsey Williams who clearly is trying to get readers to sit up with his headline question Is $600 Gold Possible?
Kelsey like other gold bugs tends to review history to a fault but below are his salient points worth considering with your morning joe.
"In looking at possible downside targets one cannot rule out a return to $1000 oz., at least initially...Technically speaking, however, there is virtually no support below the zone of $1400 – 1600 oz. Here is our final chart showing inflation-adjusted gold prices for the past fifty years…
Gold Prices (inflation-adjusted) – 50-Year Historical Chart

The chart above shows an uptrend line dating back to January 1970. That uptrend line intersects at $600 oz. within the next six to twelve months.
If we experience a multi-year decline similar to that which happened after previous peaks, then gold could still decline to somewhere close to $800 oz. several years from now.
The price of gold tells us nothing about gold. A long-term higher gold price over time is a reflection of the actual loss in purchasing power of the U.S. dollar that has already occurred.
As recently as August 2020, the gold price reflected a ninety-nine percent decline in the purchasing power of the U.S. dollar when it peaked at $2058 oz.
If you are expecting gold to suddenly turn around and move to new highs, then, by definition, you are betting on a sudden and protracted decline in U.S. dollar strength...Earlier this year, the gold price peaked on a secondary basis at $2043 oz., confirming the ninety-nine percent decline in U.S. dollar purchasing power that we mentioned earlier.
What I said then is just as valid and important now; especially if you have expectations for higher gold prices…
“We have heard much lately from those who claim that gold could easily rise to $3000 oz. or more; maybe even $10,000 oz. Some say it could happen quickly, too.
Those prices are possible, of course; but likely not quickly or easily. That is because gold – at $2000 oz. – already represents fully a ninety-nine percent decline in the purchasing power of the US dollar.
In order for gold to rise beyond $2000 oz., and stay above that number or increase to a higher level, there would need to be further significant declines in US dollar purchasing power that is apparent and permanent. (Gold At $2000 or $600? – No Difference)
Stop looking to gold for the answers. The only thing you need to know about where the gold price is headed is what the U.S. dollar is doing.
Right now, the U.S. dollar is strong. As long as that strength continues, the price of gold will not go to new highs."

Closing out the column today contributor Jill Mislinski reviews Cryptocurrencies Through Wednesday, Oct. 26.
"Here are three cryptocurrency prices (BITCOMP, ETH-X, XRP-X) over time along with their trading volume. Data is sourced from Coinbase.com through Yahoo!Finance.


We have also created an index in order to chart these together given their very different pricing history. Notice that Ether tops the chart - the price of an ether has changed the most out of all three cryptocurrencies."

It would be helpful if Mislinski also charted these three against market activity as this week's rise has followed the rally in the S&P and the Dow.
I'll be back on Tuesday. Remember that malicious speech harms the social fabric in ways far greater than the damage Ye experienced to his net worth this week.

More By This Author:
TalkMarkets Image Library
Words For Wednesday: Gravity And The Dollar
Thoughts For Thursday: On The Downward Trail


