Three Charts That Say A Rally Is Ahead In The S&P 500 Index
What a difference a week makes. Since putting in a low at 1802.50 on February 11th, we have rallied an impressive 133 points in the ES Minis contract (S&P500 futures) to close this week at 1914. All in all the large caps (SPX) gained 2.84%, and the small caps (RUT) gained 3.91% and we are now poised to rally higher over the next month or so. We were perhaps a little early in our purchase of long positions in the stock market (see my last article here) but it hasn’t taken much time at all to recover those small losses and my original bullish thesis is still very much on track. Here are three charts that point to a rally ahead.
SENTIMENT
Sentiment has hit a bearish extreme recently, and all the talk in the financial media is of the S&P 500 trading down to 1600, 1500 and even 1100 – nobody is expecting a move back towards the bull market highs, and markets have a habit of doing the very thing that the least people expect.
As you may expect given the doom and gloom in the financial media, the number of AAII bulls has dwindled to very low levels in recent weeks. The actual figure comes in at 17.6%, and although this is a historically small number of bulls, we did see one lower reading in 2005. However, if we using a 10 period exponential moving average overlaid onto the data we get a slightly different picture:
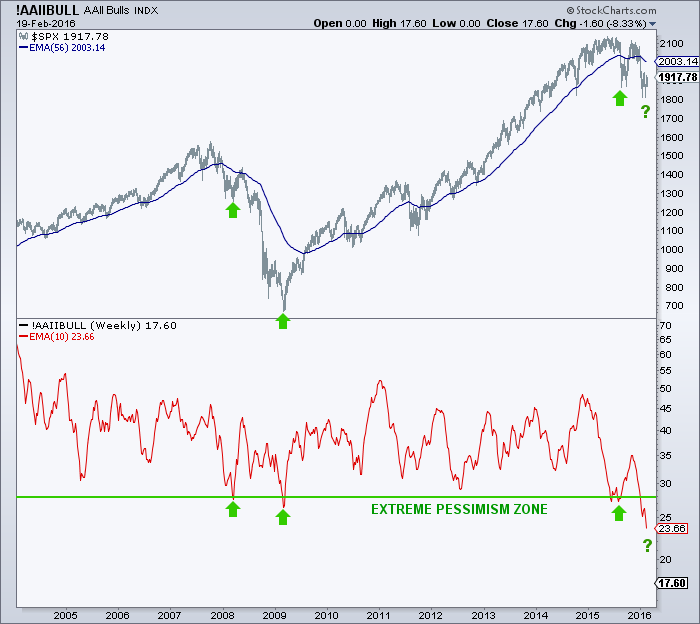
We define any move below 28 as extremely pessimistic, and prior readings at this kind of level have typically resulted in some kind of bounce. The current level is the lowest in the last 10 years. Regardless of whether or not you are bullish or bearish in the big picture, you should not underestimate the power of sentiment hitting an extreme and price reversing.
APPETITE FOR RISK
Risk on and risk off tends to be described via a multitude of asset classes, but in the most simplistic of terms we can define to it just two and ask the question are investors buying more equities (SPX) or insurance (VIX) at the present time. To find the answer we plot a ratio chart of the two assets (SPX/VIX), and when the numerator is rising we can tell that stocks are more in vogue among the investing community than insurance against a decline.
Taking it one step further we can overlay both the ‘stochastics’ and ‘rate of change’ indicators onto the ratio data, and it then gives us a defined range in order that we can tell where the extremes lie:
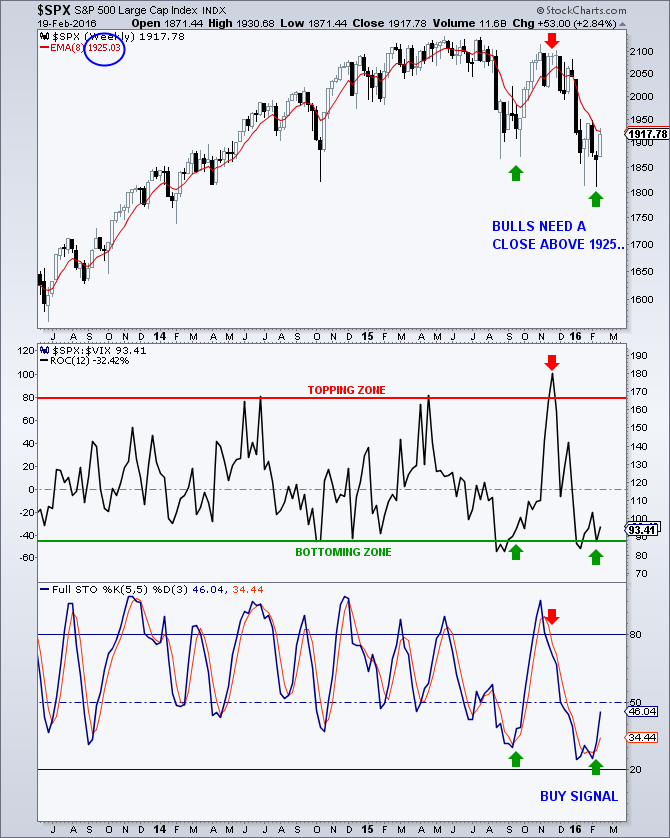
Here we can see that the rate of change indicator hit oversold and moved higher and at the same time the stochastics gave us a bullish cross. This tells us that investor conviction to own stocks has grown over the last week or two and the trend has now changed to up, at least for now. We will be monitoring this chart for signs of a turn in the weeks ahead.
SPX SIGNAL CHART
The last chart is a variation on the MACD indicator and gives buy/sell signals when the blue line turns up/down and confirms when the blue line crosses above/below the red line. As you can see it has been relatively accurate over the last year or so:
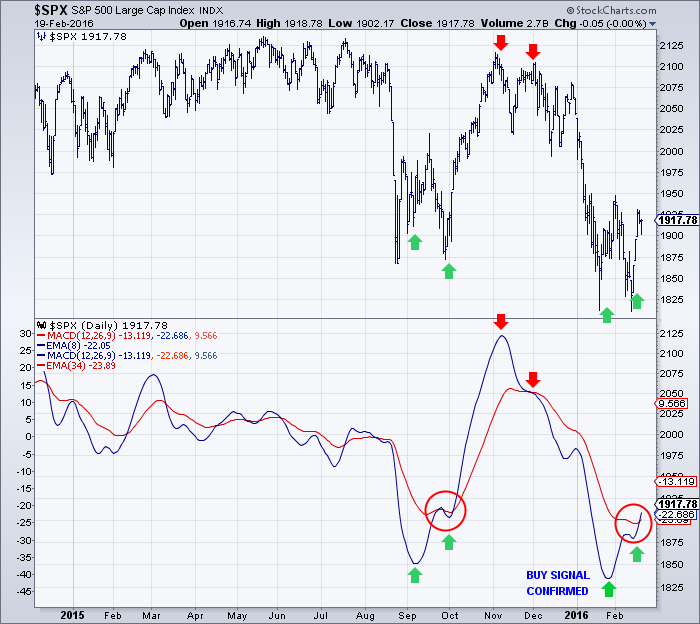
The similarity to the August low and September rally is striking, and if the pattern repeats we should see a ramp high in the near term. As with all of these charts we will be monitoring them for changes in the weeks ahead, but for now all three are giving buy signals and we are long the market.
TARGETS
Bringing is all together, we feel that a move into the 200-204 target range is feasible at the juncture in the SPY chart, and as an outside bet we have included an upper target zone in the 208-212 range. In terms of the S&P 500 cash index, our primary expectation is for a move to test the 20 month moving average at 2026 and perhaps fill the open gap at 2043.
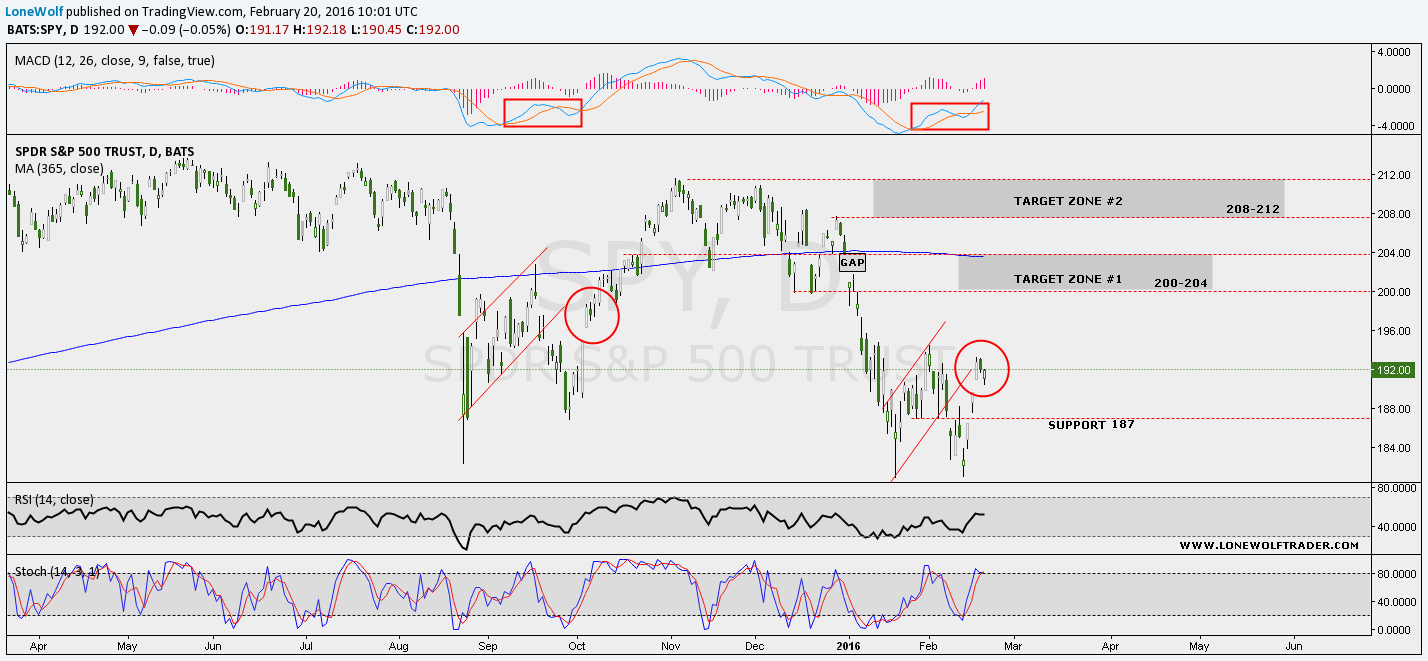
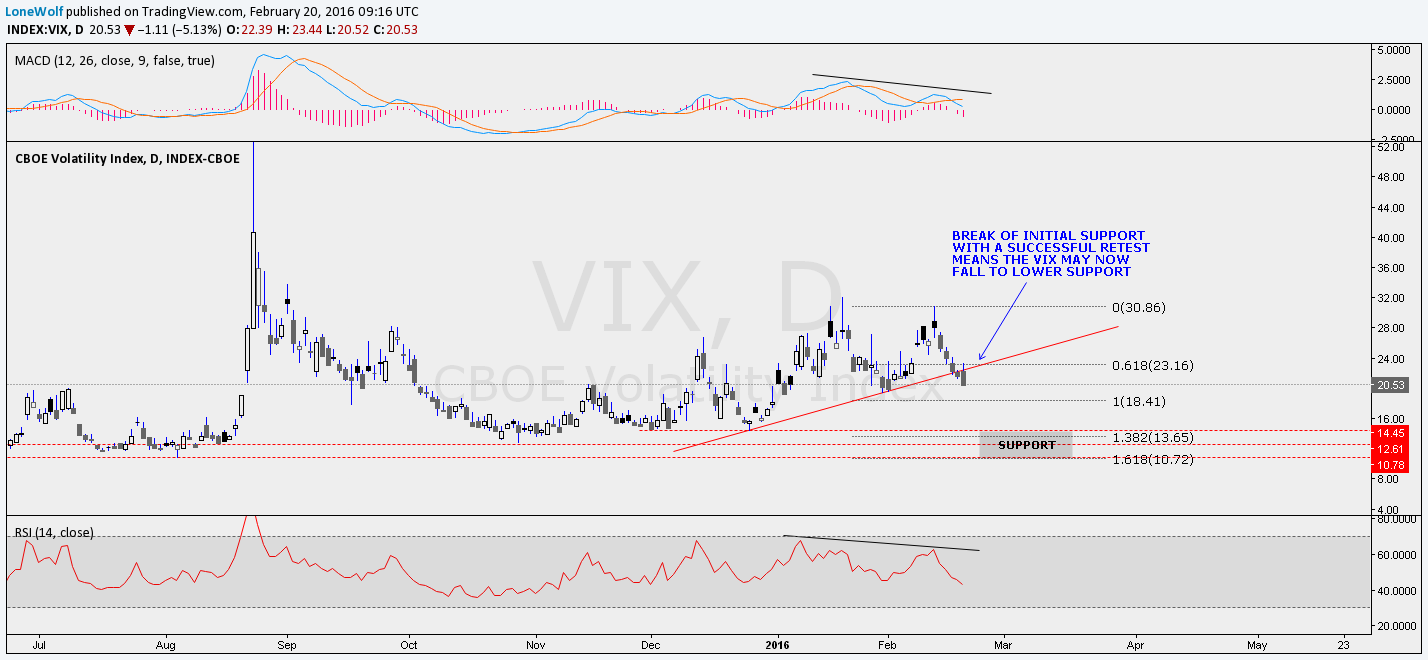
In the very short term (next few days to a week) there may be a small pullback, but we feel 1870/1880 should mark the extent of any decline. In terms of the VIX we can see that support has now broken, and although we may back-test the breakdown a little we should now make our way down to support in the 11-14.50 range.
As usual we wish you all good luck for the coming week!
This writing is for informational purposes only and does not constitute an offer to sell, a solicitation to buy, or a recommendation regarding any securities ...
more


Sounds like analyzing tea leaves to me. Any major bad news out of China or Japan, a further drop in oil, or any myriad of factors could well stymie a rebound in the SPY. As you said, the markets have a habit doing what is least expected. Others have commented that the signs are all there that global drops in stock markets indicates a first sign of a recession. Others say we are already in one. If that's the case, we could be seeing the last signs of life in the SPY as it begins to breath its last bullish breaths!
that does seem to be the consensus view at the moment yes.. however, market internals are saying something different.. so a clean break above yesterday's highs and I would be aiming for that first target zone at a minimum..