
Thoughts For Thursday: One Trillion!
One trillion is the new market value of Berkshire-Hathaway (BRK-B), the investment conglomerate built by Warren Buffet and Charlie Munger. Buffet at age 94, still calls the shots though he is known to be mentoring successors to his empire. The company's performance is legendary. In 2024 Berkshire's stock has gained approximately 28% so far versus the S&P 500 which is up 17.2% Y-t-D. It appears that Buffet who has long been admired for his keen investment skills and market insights hasn't lost his prowess, yet.
On Wednesday the S&P 500 closed at 5,592, down 34 points, the Dow closed at 41,091, down 159 points and the Nasdaq Composite closed down 199 points.
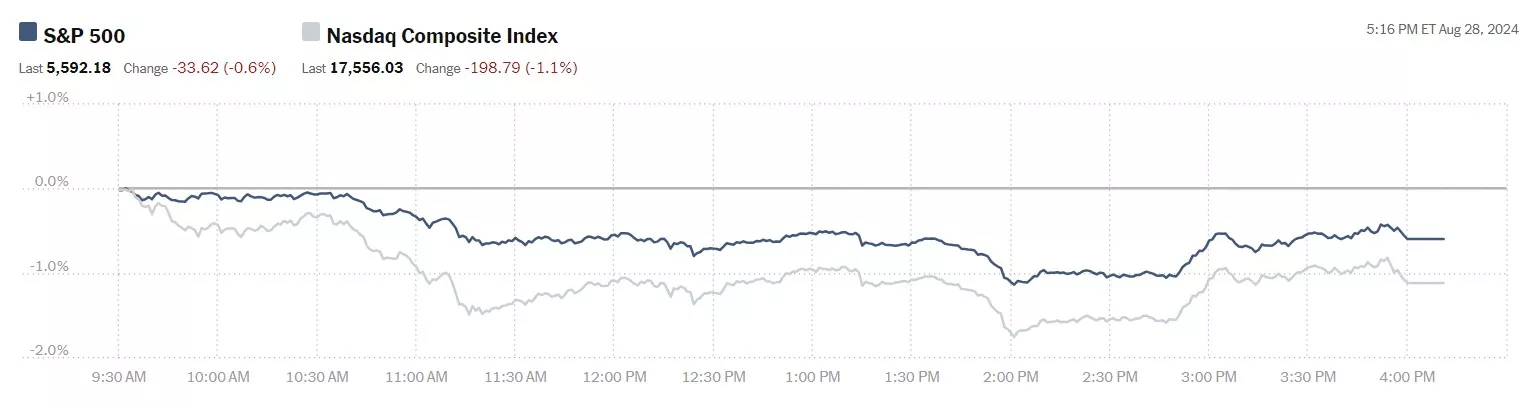
Chart: The New York Times
Most actives were led by Nividia (NVDA), down 2.1%, followed by Tesla (TSLA), down 1.7% and Intel (INTC), down 2.3%. Intel has been competing with Ford Motor Co. (F), for the number 3 spot in the last couple of weeks. Yesterday, Ford was down 0.9% and ranked number five.
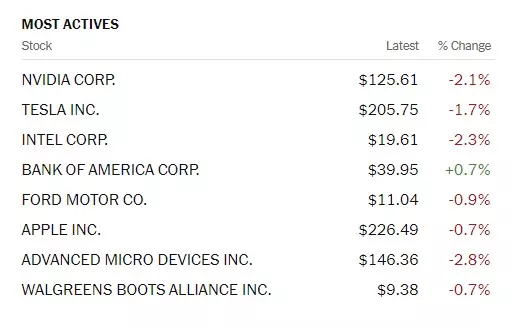
Chart: The New York Times
In morning futures trading S&P 500 market futures are up 11 points, Dow market futures are up 252 points, and Nasdaq 100 market futures are up 61 points.
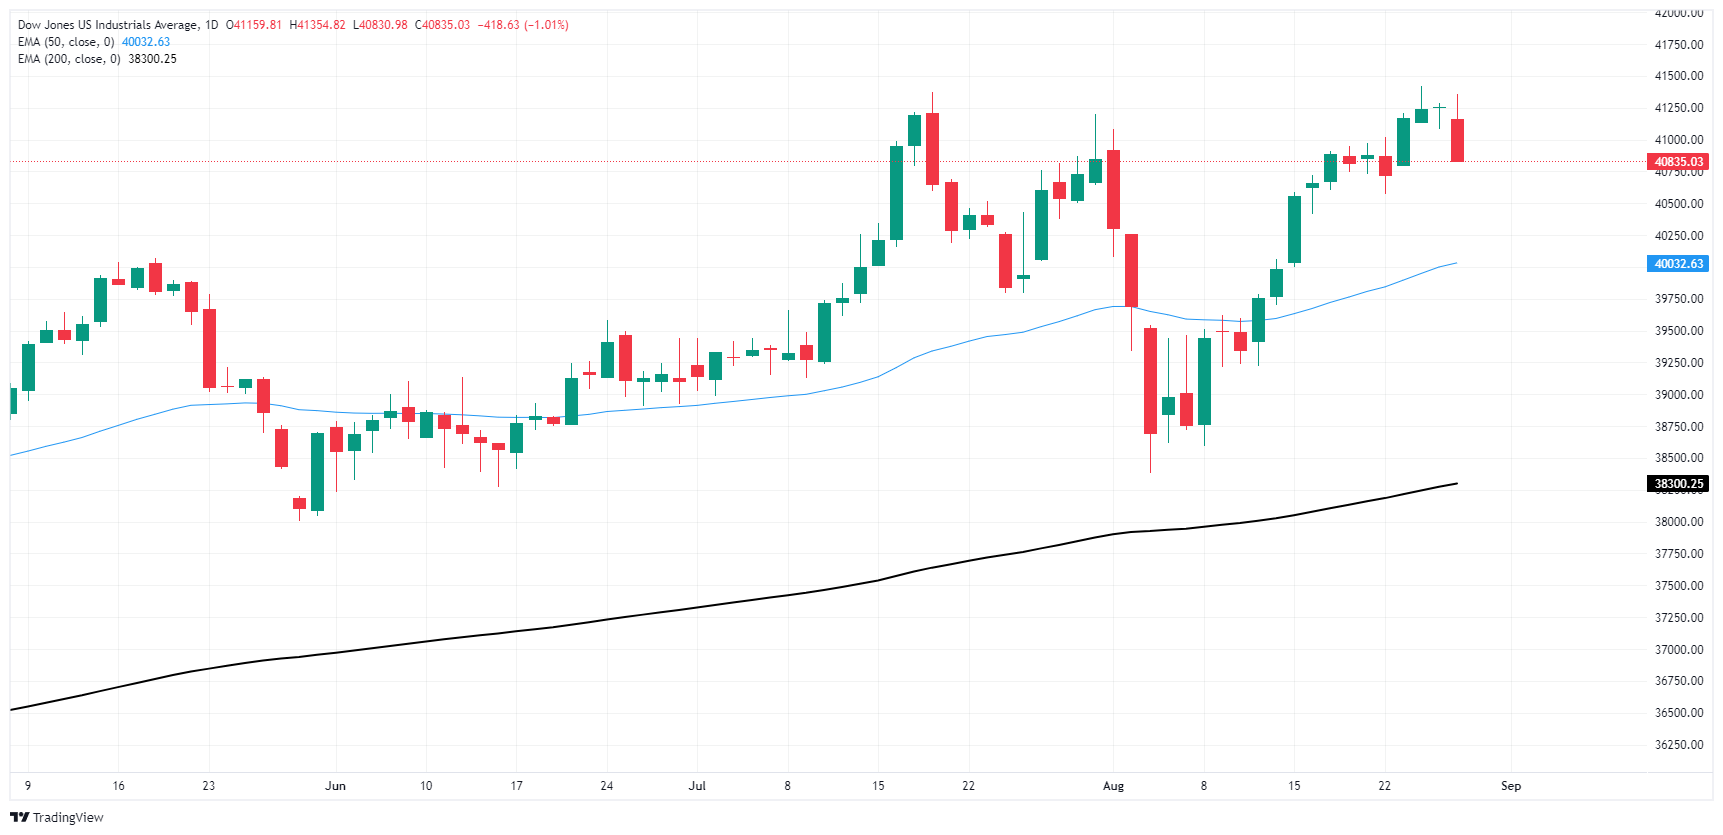
TalkMarkets contributor Joshua Gibson writes that the Dow Jones Industrial Average Pares Recent Gains As Investors Take A Pause.
"The Dow Jones Industrial Average (DJI) trimmed near-term gains on Wednesday, backsliding 150 points in the midweek market session. A downgrade to China’s Gross Domestic Product (GDP) forecast has investors concerned about a possible overhang in global trade, but most of the market is buckling down for the wait to Friday’s US Personal Consumption Expenditure Price Index (PCE) inflation print...
With bullish pressure running out of gas near fresh all-time highs beyond 41,250, bids are poised for an extended backslide to the 50-day Exponential Moving Average (EMA) rising through 40,000. Despite a near-term crimp in bidding momentum, short positions in the Dow Jones are unlikely to find a clear path all the way back to the index’s last major swing low below 38,500.
We certainly hope the Dow doesn't tumble that far.
Contributor Tim Knight says running with the big guys is not always for good in The Curse Of The $SPX.

I was curious what day the geniuses at Standard and Poors decided to add SMCI to the hallowed halls of the S&P 500. In the five months since then, it has lost almost 70% of its value. So, umm, yeah, good work, you numb-nuts.
I think Mr. Knight goes a little too far with his "analysis" no matter what the chart shows. A more probable reason is as Yahoo Finance reports, "Super Micro Computer's stock is plummeting following the company's announcement of a delay in filing its 10-K annual report. This development comes in the wake of accusations of "accounting manipulation" made by short-selling firm Hindenburg Research."
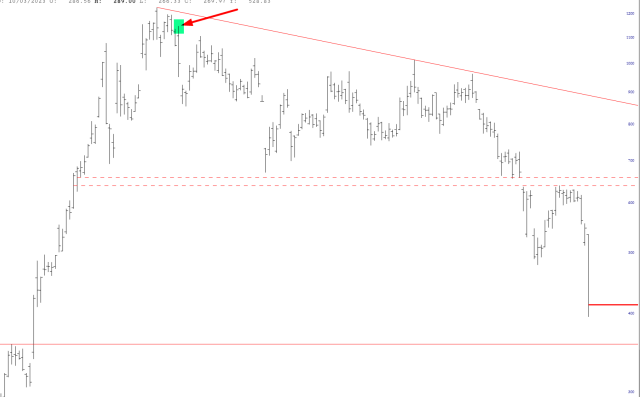
TM contributor Greg Feirman interprets The Implications Of The Reaction To NVDA Earnings.
"Nvidia reported a terrific quarter after the close Wednesday – but its stock is currently -7% in the after hours. What does it mean...
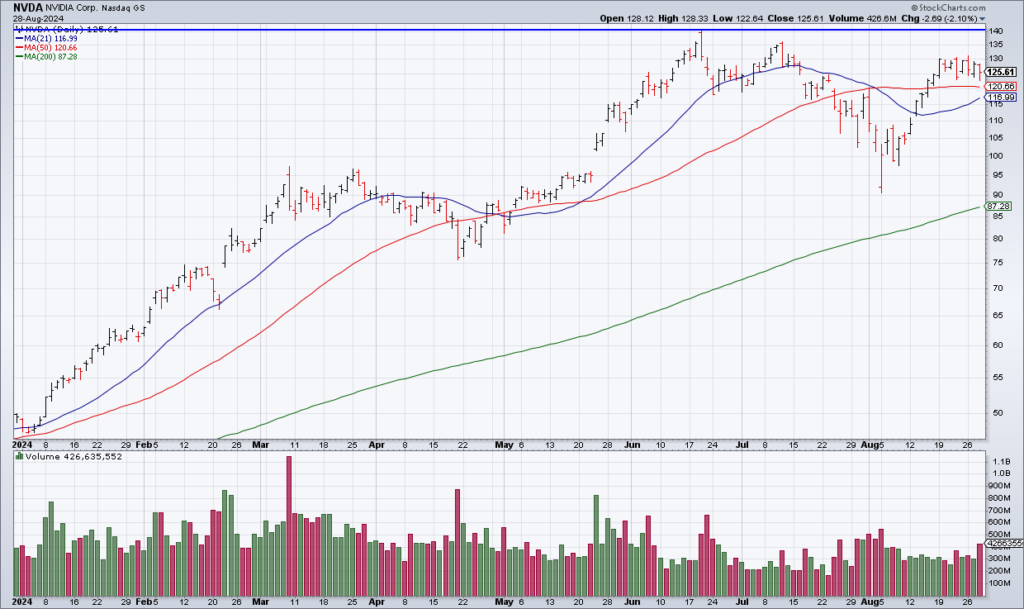
Let’s start with the numbers. Revenue of $30 billion beat guidance and estimates as did 3Q guidance of $32.5 billion. In fact it’s hard to quibble with anything in what was an outstanding quarter. Then why is the stock down?
When a stock sells off on good news it frequently means that everybody who wants to be in at current prices is already in. At the end of the day the market is supply and demand so even though NVDA reported a terrific quarter the stock doesn’t necessarily have to go up. At 50x current year earnings – which may even be peak earnings – there simply may not be sufficient demand for shares at these prices...
Beyond NVDA itself this reaction bodes poorly for the overall market. That’s because due to its size and volatility, the reaction to NVDA earnings has the most impact on the S&P 500 of any other stock by far. In other words, Thursday is likely to be a bad day for the overall market as well as for NVDA. Indeed, I am convinced that the rally that started on Monday August 5th is now confirmed as a bull trap and a new bear market began at the beginning of July."
Hmmm, that doesn't sound good.
Contributor Dionysis Partsinevelos asks Are Rate Cuts Actually Bullish And Can We Trust The Fed To Get It Right?
"In a highly anticipated speech at Jackson Hole, Wyoming, Federal Reserve Chair Jerome Powell signaled that the time has come for US interest rate cuts, pointing towards the end of the aggressive monetary policy in the US...
This recent shift in the macroeconomic regime has provided a breathing room for the markets, but investors should be asking two important questions right now: Can we trust the Fed to get it right this time and are these rate cuts a bullish signal for the markets...
The Federal Reserve has been signaling a shift in its monetary policy stance, with rate cuts likely on the horizon...Inflation data has been encouraging, showing signs of moderation after stalling earlier in the year.
However, the labor market has shown unexpected weakness, with July’s job market report triggering a significant market sell-off and raising recession fears.
This has led some investors to bet on a more substantial 0.5 percentage point rate cut in September, although the consensus still leans towards a standard 0.25 percentage point reduction.
Looking ahead, the Federal Reserve is expected to commit to at least two rate cuts before the end of the year, starting with a 0.25 percentage point reduction in September, while another cut anticipated in December.
In the meantime, some market participants expect more aggressive cuts, but the Fed is expected to proceed cautiously, reducing rates gradually as inflation eases and the labour market shows signs of weakening.
Further rate cuts are expected in 2025, with the Fed potentially lowering rates four more times, aiming to bring the policy rate closer to the neutral rate of around 3.25%...
Are rate cuts actually bullish?...
When rate cuts are seen as a proactive measure by the Fed to sustain an already strong economy—such as during the mid-1990s—markets tend to respond positively.
Investors anticipate that lower rates will boost corporate profits, encourage consumer spending, and push asset prices higher.
However, when rate cuts are perceived as a response to significant economic distress, the reaction can be more subdued or even negative.
Historical examples, like the early 2000s and the 2008 Financial Crisis, show that rate cuts driven by fears of a recession or financial instability can lead to market volatility and a sharp decline in investor confidence...
Currently, stocks are reflecting a “soft landing” scenario for the US economy, where traders expect the Fed to successfully lower borrowing costs without exacerbating labor market weakness...if negative economic data emerges in the coming months, the Fed could be pressured to implement a more substantial rate cut.
While this might provide short-term relief, it could also send panic signals throughout the market, suggesting that the economic situation is more dire than previously thought.
This combination of high valuations and potential economic weakness makes the Fed’s next move particularly risky, and a negative reception from the market seems increasingly likely.
Given the Fed’s questionable track record in navigating past economic challenges, investors should apply their own critical thinking and look beyond the central bank’s statements, paying close attention to underlying economic signals before making any important investment decisions."
See the full article for a more detailed view.
Closing out the column contributor Mish Schneider looks at Supply And Demand In The EV Market.
"Those of you who read my predictions know that I am long term bullish in alternative energy and in electric vehicles. Looking domestically, recent price cuts in EVs have spurred new buyers.

Simple economic formula is that when supply exceeds demand, that leads to lower prices. The EV inventory has quadrupled since 2021. Plus, used EVs take longer to sell than gas-powered cars. Nonetheless, price pays, and so used EV models priced between $20,000 and $30,000 sell faster, reportedly within 30 to 36 days compared to 39 days for gas cars. However, let’s look at the other side of the equation. Jobs in clean energy vehicles grew by 11% in 2023, with the fastest growth in battery-electric vehicles. But major carmakers have pulled back or scrapped altogether some of their EV plans due to the waning appetite.
This is exactly how simple economics works...

Rivian (RIVN) appears to have bottomed in April 2024. Since then, the trading range is 12.50-19.00. Currently, Rivian is breaking back down under both the 50 and 200-daily moving averages. However, this is unconfirmed and will resolve one way or another tomorrow. Rivian has improved performance against the benchmark. And the momentum indicator tells us that there is a bullish divergence. The July 6-month calendar range low is holding. Longer term, we like Rivian. Shorter term we would like to see the stock return over 15.00. As far as a shift to a sustained buy in EV stocks, both Tesla and Rivian are following the overall market moves, and both look worth watching at these levels."
That's all for today.
Peace.

More By This Author:
Tuesday Talk: Perils Of Telegramming
Thoughts For Thursday: Waltzing With Walz
Tuesday Talk: Jackson Hole And Digging Holes


