Thoughts For Thursday: One To One And One
The US Dollar and the Euro are at or near parity, 1:1 and while Bostic is suggesting the Fed may hike up 1, the Royal Bank of Canada reached that (rate hike) summit yesterday.

The stock market spent much of the day climbing a bit higher taking in the 41 year high of the June CPI number, when Atlanta Fed President Bostic suggested the Fed may go for a 1% rate hike in July instead of the already built-in 0.75%. That news created a bit of an end of the day hiccup and markets closed lower.

Chart: The New York Times
The S&P 500 closed at 3,802, down 17 points, the Dow Jones Industrial Average closed at 30,773, down 208 points and the Nasdaq Composite closed at 11,248, also down 17 points.
Asian markets were mixed, with the Nikkei up for the day and the Hang Seng down. Both the FTSE and the Dax have started the day on the down side.
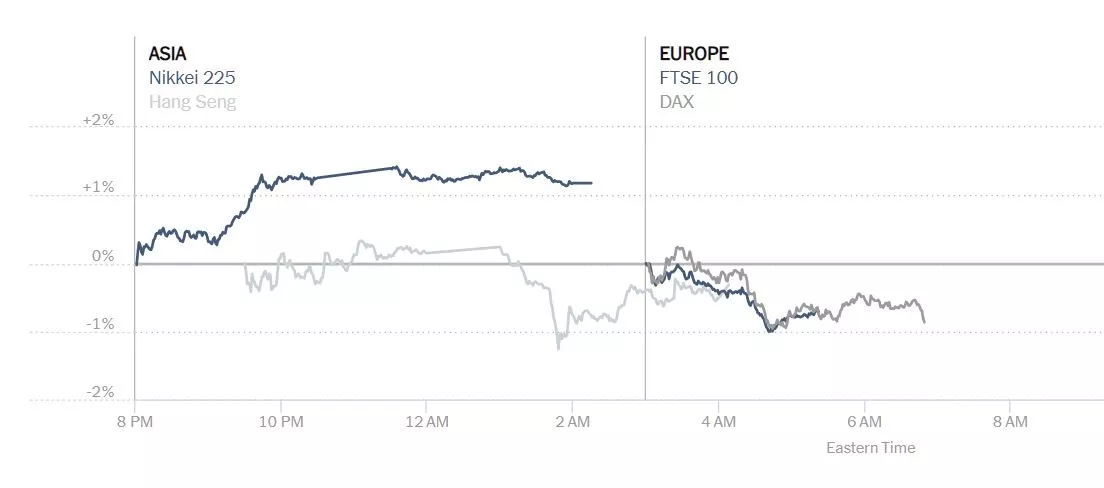
Chart: The New York Times
In morning action, market futures are currently trading in the red. S&P 500 market futures are down 52 points, Dow market futures are down 434 points and Nasdaq 100 market futures are down 117 points.
TalkMarkets contributors are all over the place this morning, which perhaps is further evidence that "One is the loneliest number"...![]()
Contributor Charles Hugh Smith writes about U.S. Dollar Strength: "Unintended Consequences" Or "The Empire Strikes Back"?
Smith takes a look at what the continued strength of the dollar as a safe-haven currency means for U.S. trading partners. Here is some of what he has to say:
"A great many people got the U.S. dollar trade wrong. The conventional view held that "printing money", i.e. expanding the supply of money, would automatically devalue the currency.
It isn't quite so simple, it seems. It depends on where the newly issued money ends up, whether the economy is expanding along with the money supply, the relative perception of the currency's stability / safety, the returns being offered in interest and capital gains for those holding assets denominated in the currency and in the broadest sense, the stability, transparency and adaptability of the nation / entity issuing the currency."

"The conventional view holds that this is the result of the Federal Reserve raising interest rates and slowing the expansion of the money supply to combat rising inflation. But this focus on the domestic economy overlooks that the Federal Reserve is also a central bank for the entire global economy...
This sets up the question: are the global knock-on effects of USD strength merely "unintended consequences" of domestic policies or are they "The Empire Strikes Back"? The consensus holds that the USD's crushing of other currencies is nothing more than an unfortunate unintended consequence of Fed tightening. This blindness to the Fed's global role is striking. Does the Empire really not anticipate the global consequences of strengthening its currency?
How unintended can these consequences be? My guess: not very.
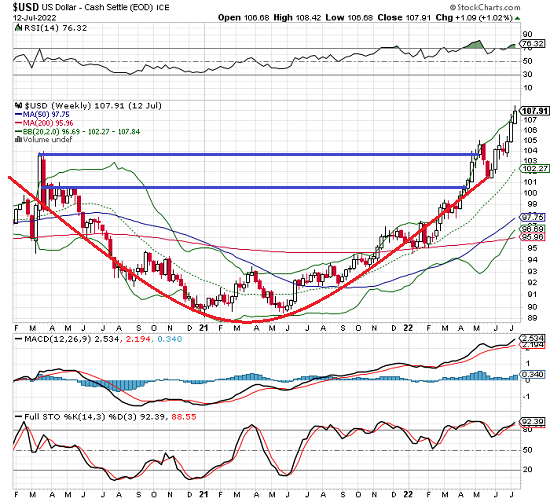
Technically, the USD has carved out a classic rounding bottom and broken above recent resistance levels. Is this the end of USD strength, or merely Stage I in a much larger-scale process of Core and Periphery playing out? My guess is it's a much larger-scale process of Core and Periphery playing out. Time will tell.
TM contributor Ironman stays closer to home and looks at Average Earned Personal Income In The 21st Century And In The Biden Era.
"Trends in how Americans' incomes are changing can tell us quite a bit about the relative health of the U.S. economy. One of the simplest measures we can follow is the country's average earned wage and salary income per capita. The following chart shows that data from January 2000 through May 2022, covering the 21st century to date:

The chart tracks both nominal and inflation-adjusted income trends. One thing we quickly see is that official periods of recession coincide with significant or sustained declines in average inflation-adjusted earned income (the blue line). Meanwhile, average nominal income, shown in red, either stalls or falls during these periods."
So even from an inflation-adjusted point of view individual earned income is up since the start of the century. Still most young people feel much more financially insecure than their parents did on a same age basis. In Ironman's second chart he closes in on the last few years.

"Here, we see the growth rate of average nominal incomes has notably slowed since December 2021, while inflation-adjusted incomes have sustained declines during this period. What that means is the U.S. economy has definitely slowed during the last two quarters, but the trend for nominal income growth hasn't fully stalled out yet as of the available data for May 2022. Meanwhile, the decline in real earned incomes since December 2021 is consistent with recessionary conditions being present in the U.S. economy during this period."
Contributor and economist Scott Sumner says we need to distinguish between Stagflation And Boomflation. Boomflation?
"Inflation is a period during which price indices increase. But price indices can increase for all sorts of reasons; hence it makes absolutely no sense to study the impact of “inflation” on any other variable. That impact will always depend on what causes the inflation.
David Beckworth recently directed me to a speech by Lael Brainard (I have excerpted only a portion of what Sumner included in his article):
Brainard is right that we need to get inflation down, but the rest of the analysis makes little sense.
Here it might be helpful to distinguish between two broad types of inflation, stagflation, and boomflation. Stagflation occurs when the short run aggregate supply curve shifts to the left. This reduces real output and real income while boosting the price level. Boomflation occurs when aggregate demand shifts to the right, boosting real output and real income (in the short run) while increasing inflation. The late 1960s were an example of boomflation while 1974 was an example of stagflation. (Today we have some of each.)
In the late 1960s, Arthur Burns suggested, “there can be little doubt that poor people…are the chief sufferers of inflation.” Actually, boomflation raises real income in the short run, including the real income of the poor. Indeed the 1960s saw one of the largest reduction in poverty rates in all of US history. The inflation of the late 1960s was bad and should have been prevented by tighter Fed policy. But it wasn’t bad because it hurt the poor (in the late 1960s)...
In contrast, stagflation does hurt the living standards of the poor. But the reduction in living standards is caused by the “stagnation” part of stagflation, not the “inflation” part of stagflation. Given the existence of an adverse supply shock, a non-accommodative Fed policy that prevented any temporary increase in the overall inflation rate would hurt the poor by even more than did the stagflation. I would add that stagflation hurts both the poor and the rich, whereas boomflation helps both the poor and the rich in the short run, and hurts both the poor and the rich in the long run. Income inequality is not the issue here."
Which puts Ironman's chart above in perspective. BTW, Sumner added this humorous quip to his article, as well:
"Notice that I had to invent a word to do this post? (Boomflation) Also, notice that the economic profession has no word for “NGDP (Nominal Gross Domestic Product) growth rates”. When a science lacks words for some of the most important concepts in their field, it’s a pretty good indication that the subject is hopelessly confused."
TM contributor Zachary Scheidt says Inflation Is Hot, But Not As Bad As It Looks.

"In case you missed it, the Consumer Price Index rose 9.1 percent for the year. That number was above the 8.8% reading economists were expecting.
Prices for gasoline, groceries, rent and dental care were particularly high.
In short, the inflation number was terrible. And investors panicked when the news broke.
But despite June’s hot inflation reading, things may not be quite as bad as they appear!
There’s no question inflation is hot right now. But is it really as bad as the CPI report indicates?
Recent evidence actually points to some good signs of inflation.
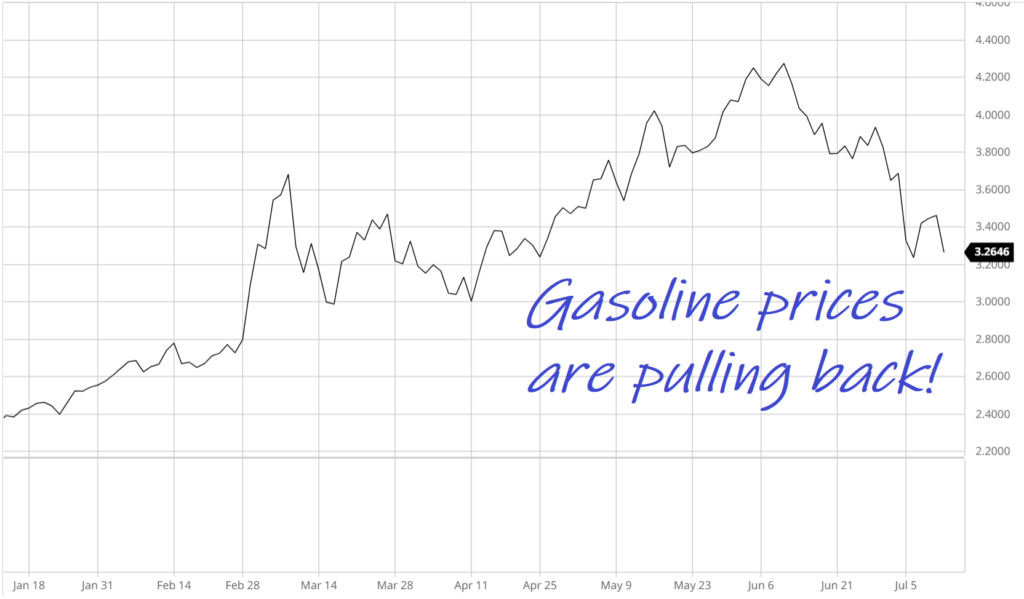
For instance, oil prices have recently pulled back. And nationwide gasoline prices peaked in the first half of June!"
"Meanwhile, concerns over inflation have driven other commodity prices lower.
Copper, steel, iron ore, and other industrial metals are actually well off recent highs. And the same goes for agricultural commodities like grains.
Meanwhile, big box retailers are struggling with too much inventory...
So even though June inflation numbers were hot, the current evidence is pointing to an economy that is cooling off. And that means lower inflation."
All of which makes Scheidt a continuing contrarian market bull.
Another bullish tending contributor Graham Summers does a rundown on what is happening in commodities markets and asks the question Is The Inflation Trade Dead… Or Is It Time To Buy? Summers finds there is no clear answer. Below is some of what he turned up. See the full article for more.
"By quick way of review, throughout 2021 and the first quarter of 2022, inflation-based investments dramatically outperformed the broader market. In particular, Energy stocks (XLE) produced outsized gains, more than doubling the performance of the S&P 500 in 2021.
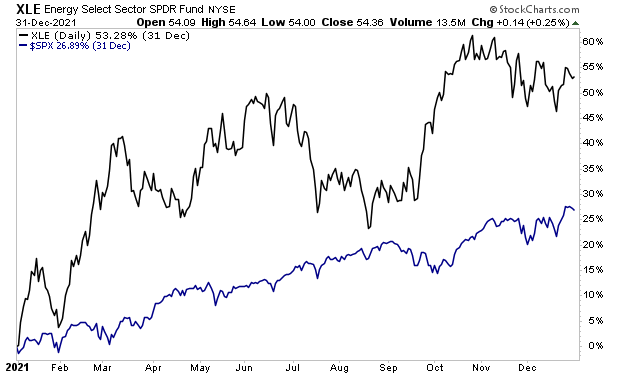
This all changed in June of this year. From that point onward inflation plays like oil, copper and the like have been collapsing. Oil fell 20% peak to trough. Copper is down 30%. Note the blue rectangles in the chart below.
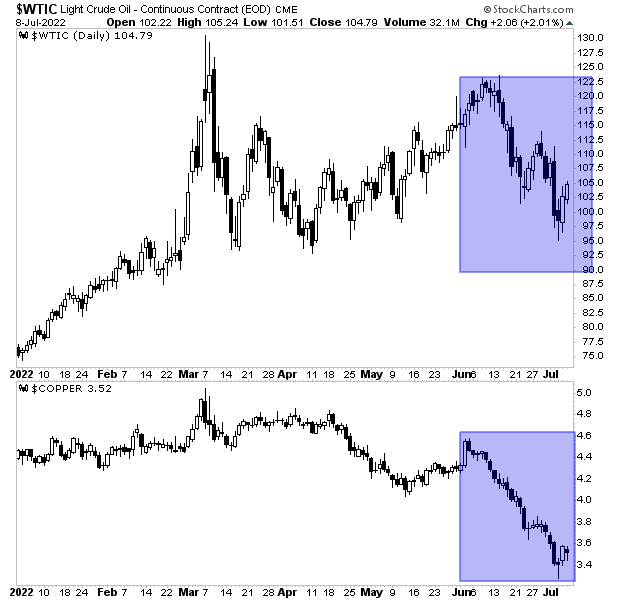
Is the inflation trade over? Not necessarily. Commodities are an extremely volatile asset class: corrections of 20%, 30%, or even 40% are common during major bull markets in commodities. Case in point, during the last big commodities run from 2002-mid-2008, oil had numerous corrections of 20%-40% before the final blow off top."
"The commodity space is at a critical juncture today. The volatility of the last few weeks is actually quite normal for the space. And the key for determining when the next leg up begins is the $USD. The $USD has been on a tear as the world is hungry for dollars. Whenever this rally ends and the greenback rolls over again, the commodity space will catch a bid."
Time will tell.
Department of Elsewhere
Unfortunately the war in Ukraine continues to roll-on. Any hopes to bringing it to a soon end depend on our keeping it in our sights (and screens) and minds.

Artwork: Rosana Schmitt
Have a good one.
More By This Author:
Tuesday Talk: Market Mash-Up
Thoughts For Thursday: Bounce Cat, Bounce!


