
The market managed to close up on a significant bounce in the last 1.5 hours of Wednesday's trading session. Whether it is the sign of a continuing upward trend remains to be seen.

The kitten clearly doesn't know what to make of things.
Yesterday, the S&P 500 closed at 3,845, up 14 points, the Dow closed at 31,038, up 70 points and the Nasdaq Composite closed at 11,362 up 40 points.
Most actives were across sectors and the swings were neutral to muted (except for CCL).
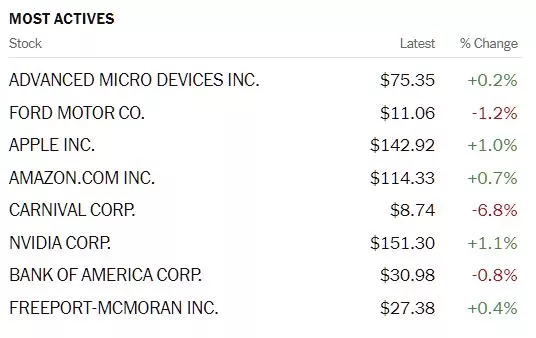
Chart: The New York Times
Asian and European markets are also trading with an upward bounce this morning, though the FTSE and Dax both appear to be a bit hampered on news of Johnson's pending resignation.
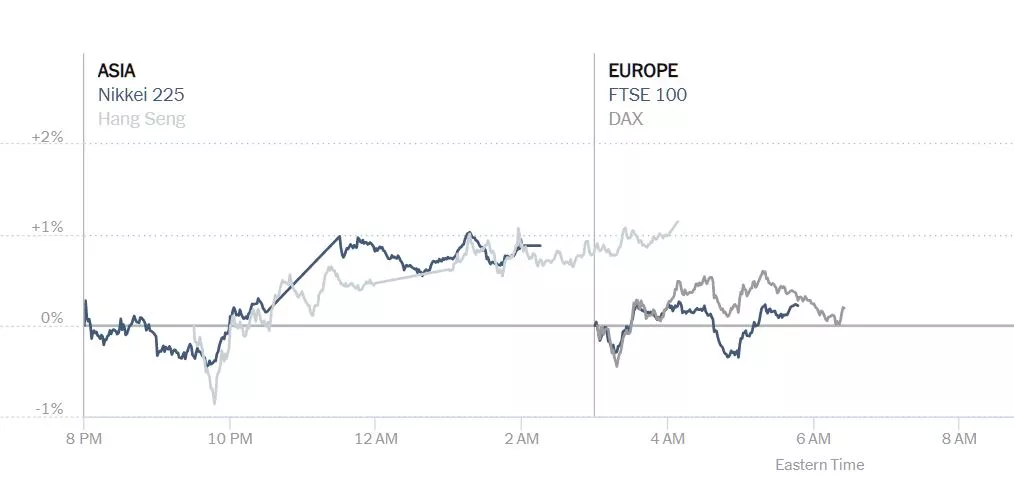
Chart: The New York Times
In morning futures trading S&P market futures are up 10 points, Dow market futures are up 110 points and Nasdaq 100 futures are up 38 points.
Contributor Jill Mislinski bounces in this morning with A Look At The Total Return Roller Coaster.
"Here's an interesting set of charts that will especially resonate with those of us who follow economic and market cycles. Imagine that five years ago you invested $10,000 in the S&P 500. How much would it be worth today, with dividends reinvested but adjusted for inflation?
The purchasing power of your investment has increased to $14,677 for an annualized real return of 7.7%."
A few of those charts are posted below. See the full article for the others.

"Volatility decreases further with a 30-year timeline. But even for that three-decade investment, the annualized returns since 1901 have ranged from less than 2% to over 11%."

"As the charts illustrate, and as many households have discovered during the 21st century so far, investing in equities carries substantial risk. Households approaching retirement should understand this risk and make rational decisions about diversification. In the past, we've suggested that they should also consider fixed income alternatives for that part of the nest egg that will pay non-discretionary expenses not covered by Social Security and pensions. Unfortunately, this traditional wisdom has been less helpful in recent years owing to the Fed Zero Interest Rate Policy (ZIRP) and various stimulus strategies, which have collectively shrunk interest rates. With the end of ZIRP in December 2015 and several rounds of Fed rate hikes, it will be particularly interesting to see how this slow-motion roller coaster plays out in the years ahead."
Interesting, indeed.
TM Contributor Tim Knight has a few thoughts on the bounce while taking a look at the E-mini S&P 500 futures chart in a short bit titled, Just A Minute…
"It wasn’t that long ago that the release of the Fed Minutes was the most unimportant non-event of any given month, but these days, the entire financial world teeters on the edge of its Aeron chairs to pick apart every word, phrase, and semi-colon. As I’m typing this, the ES and NQ are roaring higher."
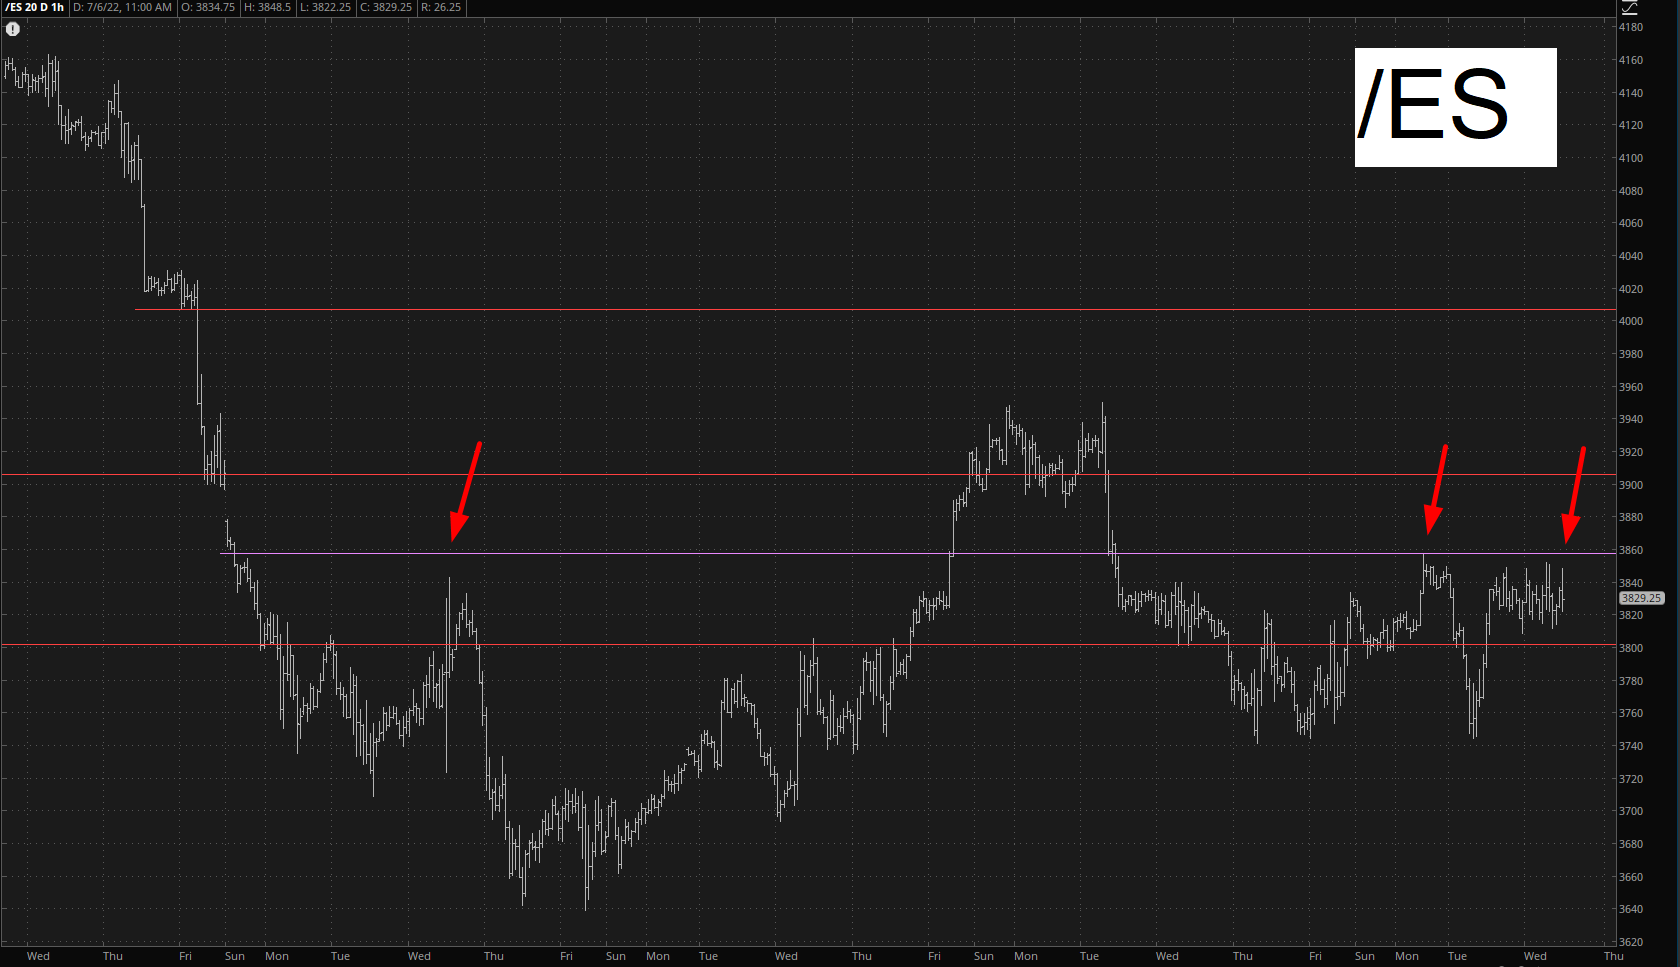
"The fly in the ointment for the bulls is that “hump” in the middle of the chart above, which was the last meaningful effort on the part of the bulls to really put together a hearty counter-trend rally (which obviously failed). Thus, even if they manage to push past that purple line, it’s going to continue to be a slog, since the intraday action has, for weeks now, been a big, fat mess (and in a relative state of equilibrium)."
TalkMarkets regular Dennis Miller does not appear to have been reassured by the Fed's remarks yesterday, headlining with The Fed’s Disaster Has Arrived.
Here is some of his current thinking and other thinking that he has found:
"Inflation is no longer a coming attraction, it’s here, turning into a disaster, and not about to go away anytime soon. Shadowstats.com tells us current government-reported inflation is over 8%. Using Carter year calculations, it’s over 16%. Our wealth is being stolen at a rate none of us have seen in our lifetimes."
Miller says the Fed's pouring dollars into the money supply has made our personal supply of dollars dwindle in value (inflation) and to make matters worse us regular Janes and Johns were swindled out of a big share of the recent stimulus packages. Citing his colleague Richard Maybury, Miller reports:
"Richard breaks it down:
“From Feb 2020 to Feb 2021, The Fed admits to pouring 4.1 trillion new dollars into the US economy.
“The population numbered 330 million. Divide $4.1 trillion by 330 million. Each American should have received $12,424.
“If you are a…typical family of four, your household should have raked in nearly $50,000 newly created dollars free. Did you? Then someone else must have received your share.”
Who got your share?
The politically connected, of course. Trillions went to the top 1% while the working class got little to nothing. Estimates show each person in the top received 230 times more money than the working class. Swindle indeed!
Webster defines malinvestment as a bad investment. Richard calls them “hot spots”, investment opportunities created by government policy, easy money, and attempts at social engineering which are economically unsound.
The Fed destroyed free-market interest rates, creating hot spots everywhere. Corporations borrowed on a massive scale, not to improve production, or increase sales – but to use the easy money to pay dividends, buy back stock and pay themselves nice bonuses. The Fed banks made free money available and it had no place to go and a ton poured into the market. The correction has now begun.
Tech companies, many still unprofitable, find their companies valued at billions. Much like the roaring ’20s, “Happy Days are here again” until they are not.
The Fed, creating trillions out of thin air, has created an inflation disaster. The Fed ignored it, trying to hoodwink the public. People are no longer fooled; but angry and afraid."
Read the full piece for more.
Contributor Andy Wang writing in Stocks Ready For A Bounce seems to be more positive than the proverbial (dead or alive) market cat.
"The past few days have been volatile, but, stocks look ready for a bounce. Since the last CPI report, even energy stocks have fallen, pretty sharply in fact...After the recent dip, SPX has been working hard to stay afloat, keeping its close above the 10-day MA in the past few days. The 10-day MA, in fact, has turned up. From the chart, we can see that the market now has quite a wide trading range, from 3650 to about 3980. Tech stocks have been beaten down hard. So, they may have more room to bounce."
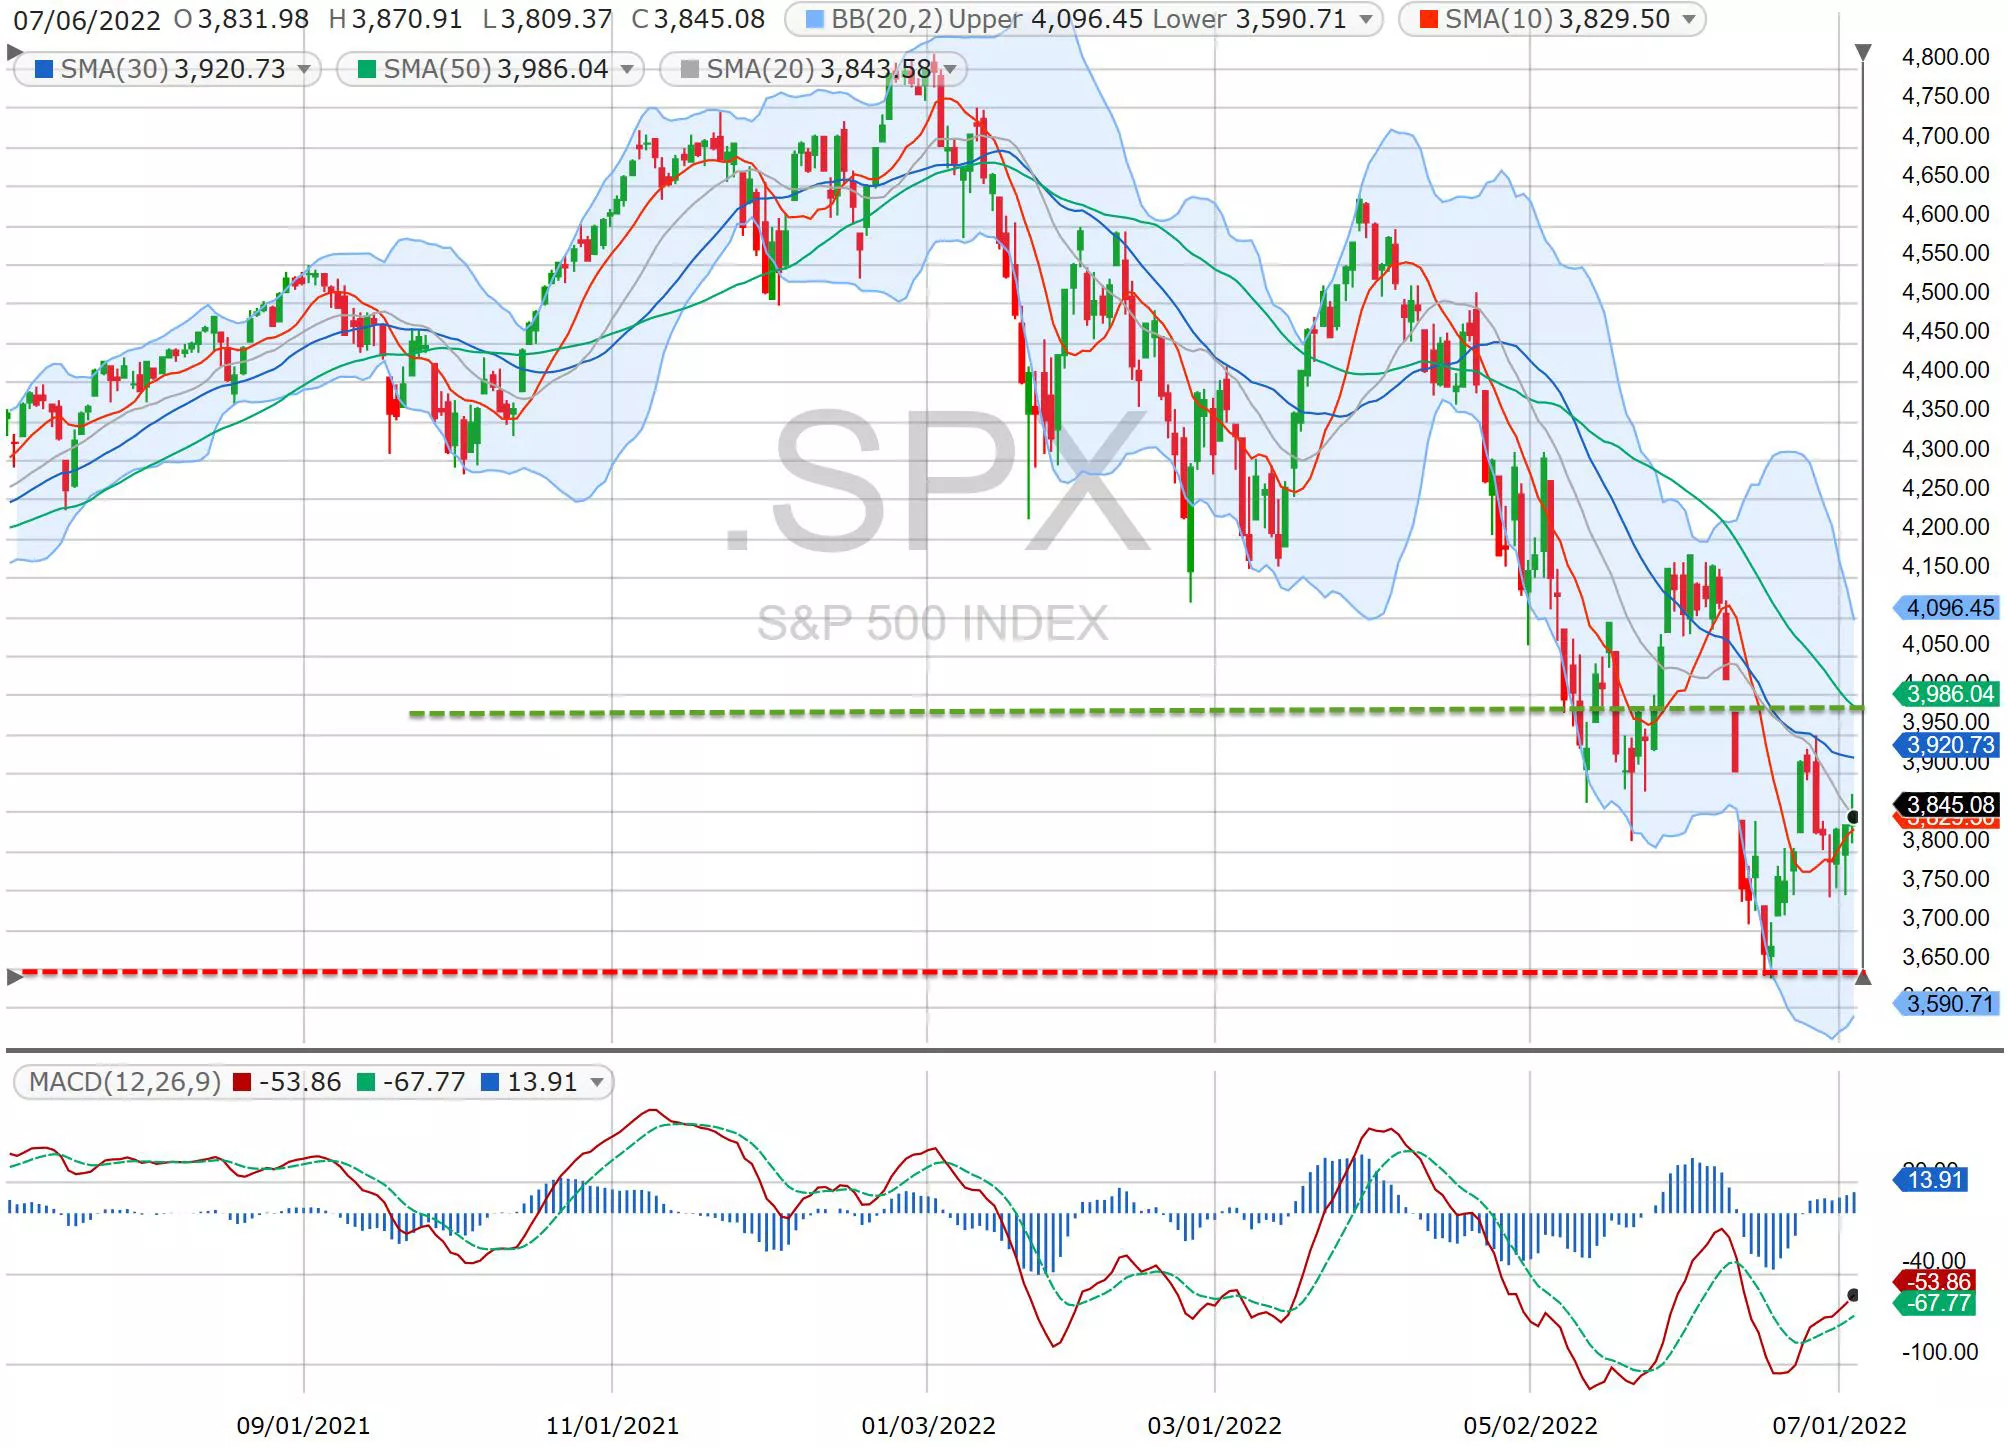
"I think we are in for a few days of "upside volatility", then, we'll have to see how the CPI is, in response to the recent interest hikes. We may see 3900 get tested again and wait for the CPI numbers."
The dollar has remained strong amidst all of the year’s tosses and turns to date and TalkMarkets contributor Sweta Killa suggests you just may want to Tap Dollar Strength With These ETFs.

"The U.S. dollar against the basket of other currencies has been gaining momentum in recent months on its safe-haven status. Rising fears of a global recession and Fed’s aggressive tightening policy have raised the appeal for greenback as a safe-haven play.
Investors seeking to make a play from this trend could consider ETFs such as Invesco DB US Dollar Index Bullish Fund (UUP), WisdomTree Bloomberg U.S. Dollar Bullish Fund (USDU), iShares Russell 2000 ETF (IWM) and iShares Currency Hedged MSCI EAFE ETF (HEFA)."
Below are Killa's remarks in abbreviated form. See the full article for more details.
"UUP
Invesco DB US Dollar Index Bullish Fund is the prime beneficiary of the rising dollar as it offers exposure against a basket of six world currencies. This is done by tracking the Deutsche Bank Long USD Currency Portfolio Index - Excess Return plus the interest income from the fund’s holdings of U.S. Treasury securities. In terms of holdings, Invesco DB US Dollar Index Bullish Fund allocates nearly 57.6% in euro and 25.5% collectively in the Japanese yen and British pound.
The fund has managed an asset base of $1.7 billion while seeing an average daily volume of around 3 million shares. UUP charges 78 bps in annual fees and has a Zacks ETF Rank #2 (Buy) with a Medium risk outlook.
USDU
WisdomTree Bloomberg U.S. Dollar Bullish Fund offers exposure to the U.S. dollar against a basket of foreign currencies by tracking the Bloomberg Dollar Total Return Index. WisdomTree Bloomberg U.S. Dollar Bullish Fund exhibits strong negative correlations to international equity and bond portfolios.
WisdomTree Bloomberg U.S. Dollar Bullish Fund has amassed $297.4 million in AUM and trades in a lower volume of about 553,000 shares per day on average. It charges 50 bps in annual fees.
IWM
iShares Russell 2000 ETF will benefit from a rising dollar. It provides exposure to a broad basket of 1,985 stocks by tracking the Russell 2000 Index, with none holding more than 0.4% of assets. iShares Russell 2000 ETF is the most popular and liquid choice in the small-cap space, with AUM of $51.4 billion and an average trading volume of around 30.8 million shares. iShares Russell 2000 ETF charges 19 bps in annual fees and has a Zacks ETF Rank #3 (Hold) with a Medium risk outlook.
HEFA
The strength in the greenback would compel investors to recycle their portfolios into currency-hedged ETFs. For those seeking exposure to the developed market, iShares Currency Hedged MSCI EAFE ETF could be an intriguing pick. It targets the developed international stock market in Europe, Australasia, and the Far East with no currency risk. iShares Currency Hedged MSCI EAFE ETF tracks the MSCI EAFE 100% Hedged to USD Index."
Caveat $$$ Emptor.
As summer continues on, so unfortunately does the war in Ukraine.

Please remember to support Ukrainian relief efforts.
Have a good one.
More By This Author:
TalkMarkets Image Library
Tuesday Talk: Fireworks and Rollercoasters - The Day After
Thoughts For Thursday: Which Way Through Uncertainty?


Comments
Log in or sign up to join the conversation.