
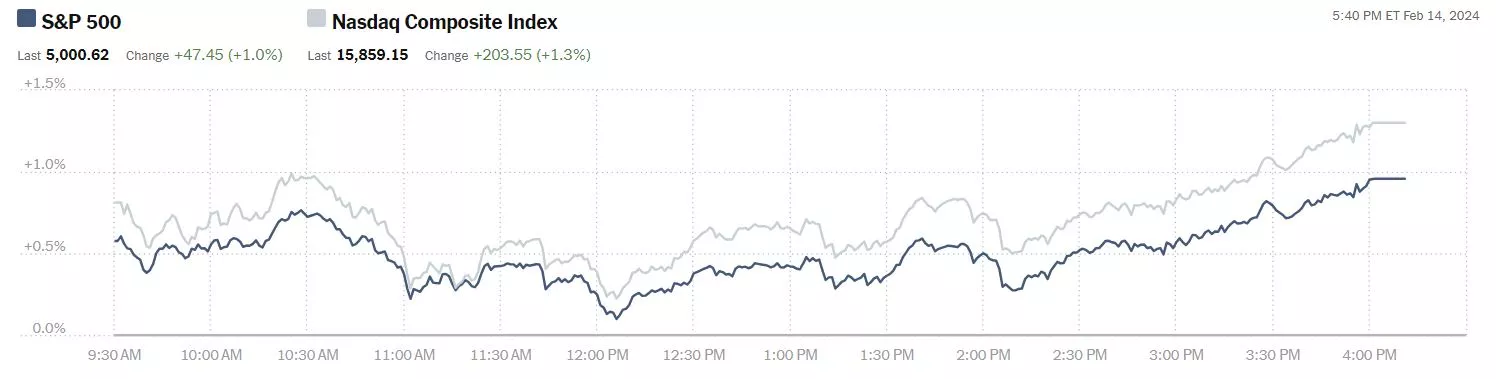
The S&P 500 has hit the 5,000 mark and though it has also fallen below that line it seems to be the new line in the sand. The Dow and the Nasdaq are also hitting new highs. What is cautioning us all from breaking out the champagne is the very uncertain geopolitical situation in which we find ourselves.

Always something to rain on the party, eh?
On Wednesday the S&P 500 closed at 5,001, up 47 points, the Dow closed at 38,424, up 152 points, and the Nasdaq Composite closed at 15,859, up 204 points.
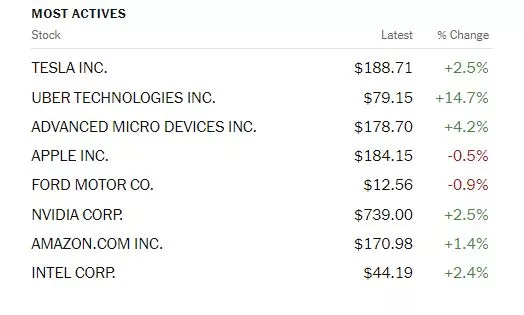
Most actives were Tesla (TSLA), up 2.5%, followed by Uber Technologies (UBER), up 14.7% and Advanced Micro Devices (ADM), up 4.2%.
In morning futures trading, S&P 500 market futures are up 6 points, Dow market futures are up 56 points and Nasdaq 100 futures are up 16 points.
TM contributor Declan Fallon looks at the indices in Russell 2000 Fails Its Breakout, Dropping Back Into The Prior Consolidation
"I wouldn't classify it as a "bull trap" as Monday's breakout in the Russell 2000 was an internal base breakout, but the drop back into this base places greater significance on support around $190...

The Nasdaq is recovering from its gap down, although there wasn't too much technical damage from this gap. Symmetry could be important here, and what happened in December could repeat here. If this proves true, the next breakout won't come until March. Technicals support this thesis.

For the S&P, read the Nasdaq. Same setup, the same potential outcome.

The semiconductor index has been performing relatively methodically, moving in step sequence through its bases. For Thursday, we are probably looking at a support test of $190 in the Russell 2000 and a closure of the breakdown gaps in the S&P and Nasdaq. The Semiconductor Index is primed at resistance; any gain tomorrow would likely qualify it as a breakout, which would be positive news for both the S&P and Nasdaq."
Economist and TalkMarkets contributor Menzie Chinn looks at Output Gap Measures.
"Are we at full employment? Here are some estimates:

Figure 1: Output gap, from CBO (blue), from OECD (tan), from IMF (green), from Fleischman/Roberts-FRB (red), all in % of potential GDP. NBER defined recession dates shaded gray. Source: CBO February 2024, OECD November 2023, IMF October 2023, Atlanta Fed Taylor rule utility February 2024, NBER.
Higher frequency estimates are available for the CBO and one version of the FRB gap series:

Figure 2: Output gap, from CBO (blue), from Fleischman/Roberts-FRB (red), both in % of potential GDP. NBER defined peak-to-trough recession dates shaded gray. Source: CBO February 2024, Atlanta Fed Taylor rule utility February 2024, NBER.
Interestingly, post-pandemic this particular FRB measure has been consistently higher than the CBO measure — until 2023Q4. (Note that the members of the FOMC are not all going to rely on this specific measure.)"
In an "In the Spotlight" piece for Talkmarkets, contributor Burton Rothberg asks Why Haven't Oil Prices Gone Up?

"War in the Middle East, blockade of major shipping routes, the slowing of the “energy transition!” In the past any one of these would have been enough for a bull market in oil. But here we are with WTI around $75. What’s going on?
The answer, as is almost always, supply and demand. Let’s start with demand.
I’ve looked at a few of these forecasts and they are pretty similar. Here’s one from Exxon (XOM):
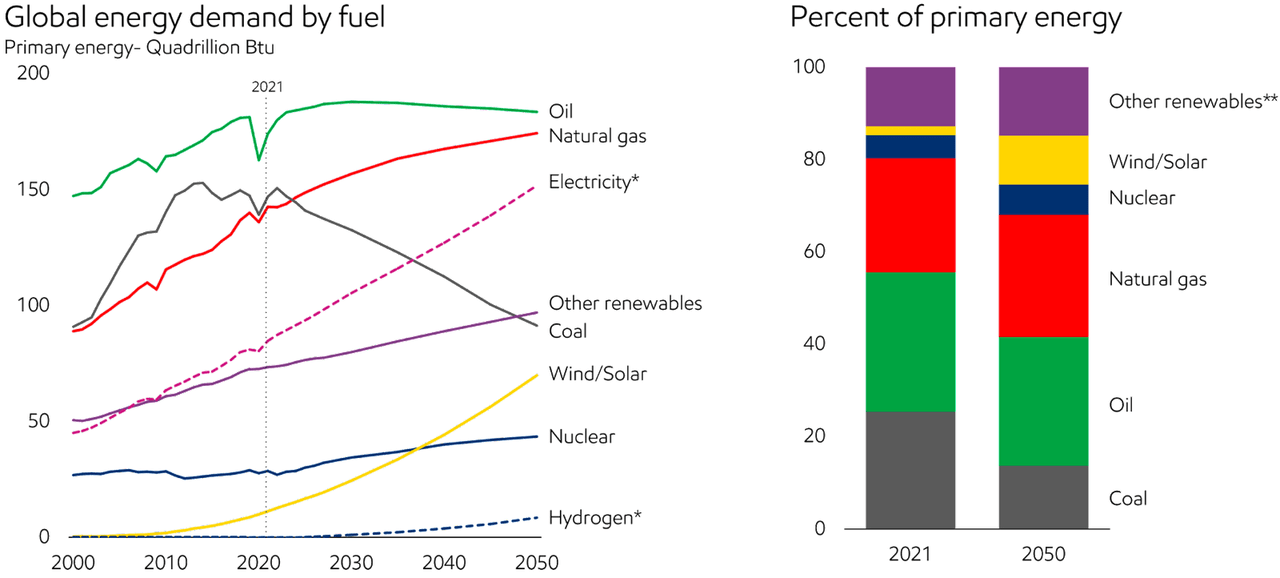
Fossil Fuel Demand Forecasts (Exxon-Mobile)
You can see that oil consumption peaks right about now and then only slowly tails off. Natural gas is on a sharp ramp up as it replaces coal in thermal generation. So the world will continue to need about the same amount of oil as now, and more gas, for a long time.
What about supply? Here’s where it gets interesting. At least in the US and Canada, the actual cost of getting oil out of the ground has been declining. Prices are made at the margin, and the US is now the marginal supplier of oil. Let’s start with the US PPI for oil drilling:
The extraction cost of oil has come down. Published costs are all over the map, largely because of different definitions of what “cost” is. After reading various reports, here’s what I believe full cost is:
US shale $55 per bbl.
Canada (total) $50
Brazil $49
Nigeria <25
Will this decline continue? Technology forecasting is always difficult, and I’m only going to say “probably”. The majors are investing huge amounts of money into buying up smaller company shale properties. These companies have access to the latest data, and they wouldn’t be making these investments if they thought they couldn’t make money on them. Also, technology changes often play out over a long period of time, so the odds are on the side of progress...
What does this mean for listed oil companies? First, their costs are declining. That’s good. But since the marginal supplier (the USA) is the one whose costs are declining, that means lower selling prices. That’s bad. On this basis it should be roughly neutral.
But there’s another issue at play here. OPEC+ is not likely to take continuing lower prices lying down. At some point they are possibly going to reassert their market power. This could lead to another price war. Now I’m not forecasting when this will happen or even if it will. But the threat of it is going to hang over the market for some time. This will lead to lower multiples for oil equities. We are already seeing this. Take Exxon-Mobil (XOM ), for example, a great barometer of energy equities. It is trading at a multiple of 41% of the overall market. Here’s a graph of XOM's PE multiple versus the overall stock market PE:
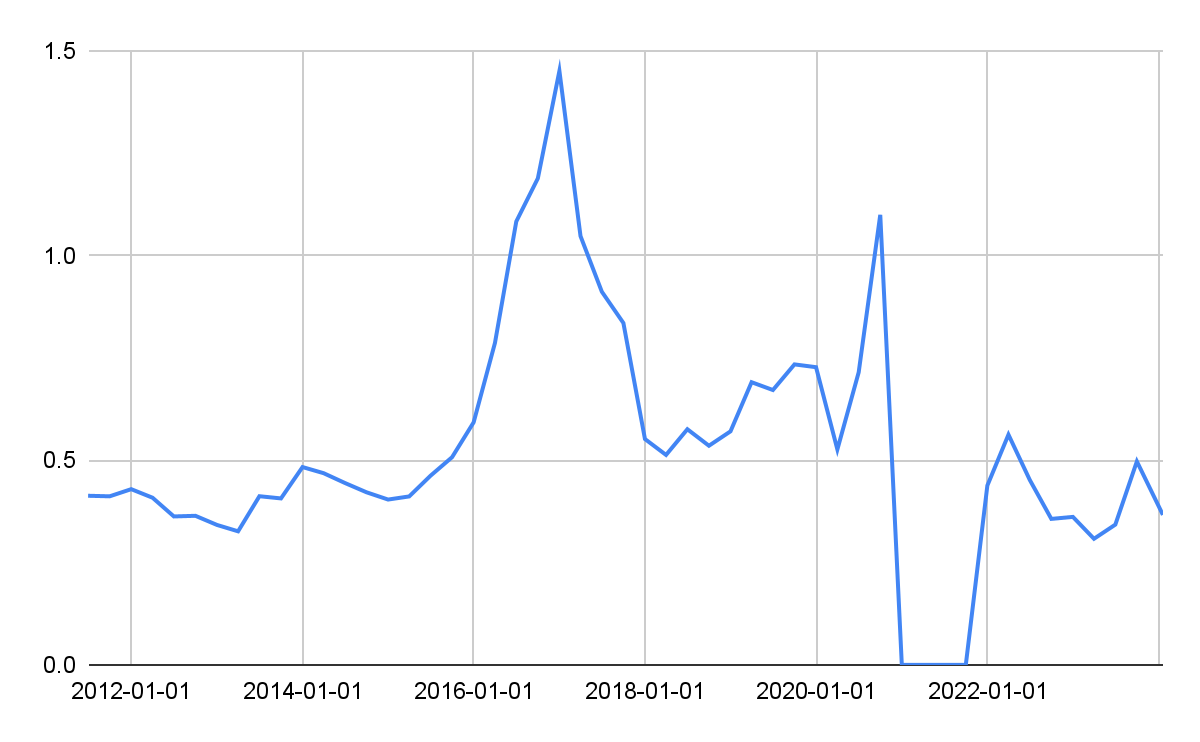
XOM PE / SP500 PE (Author's Calculations)
The break in the curve around the pandemic is because XOM was losing money then. XOM’s PE is only 41% of the overall market. That seems like good value, but I expect that to continue to be low.
Here's how I am playing this. I believe the dividends of the majors are safe, so I hold a smallish position for income. But the big play will be if OPEC brings down the hammer. This would lead to a repeat of what has happened many times in the past - much lower oil prices for a year or so. Given the long term pessimism for fossil fuels, this would probably lead to much lower oil equities. That is the opportunity I am waiting for."
To close out the column today TM contributor Sheraz Mian finds Q4 Results Paint A Positive Earnings Picture.
"
Here are the key points:
- Total Q4 earnings for the 369 S&P 500 members that have reported results are up +5.8% from the same period last year on +3.6% higher revenues, with 79.1% beating EPS estimates and 64.8% beating revenue estimates.
- The Tech sector is solely responsible for keeping the Q4 earnings growth pace in the positive territory. Had it not been for the Tech sector's strong growth, the +5.8% earnings growth for the companies that have reported already drops to a decline of -0.1%.
- The Tech and Energy sectors are having the opposite effects on the Q4 earnings growth pace, with the Energy sector pulling it down and the Tech sector giving it a boost.
- Excluding the ‘Magnificent 7’ – Apple (AAPL), Amazon (AMZN), Alphabet (GOOGL), Microsoft (MSFT), Meta (META), Nvidia (NVDA) & Tesla – whose Q4 earnings are on track to be up +48.7% on +14.5% higher revenues, total earnings for the rest of the index would down -2.9% on +1.8% higher revenues.
In this space, we have discussed the impressive earnings performance of the Magnificent 7 companies in the ongoing Q4 earnings season and how these strong growth numbers validate these companies’ market leadership...
You can see the group’s earnings and revenue growth picture in the chart below.
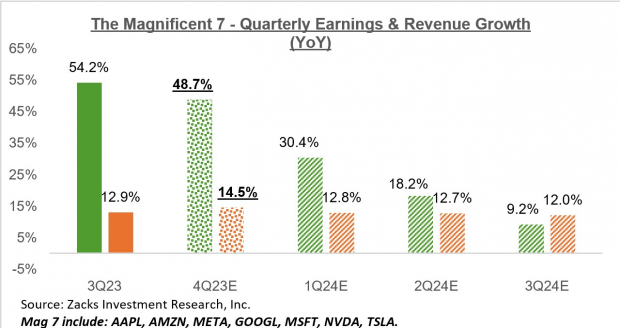
Image Source: Zacks Investment Research
As you can see in the chart above, the group is currently expected to achieve +30.4% more earnings in 2024 Q1 on +12.8% higher revenues, with earnings growth in 2024 Q2 expected to be up +18.2%.
The Mag 7 companies combined are on track to account for 22.8% of all S&P 500 earnings in Q4; they account for 29.5% of the index’s total market capitalization. Had these 7 stocks been a sector, they would have the second biggest weight in the S&P 500 index, behind the Tech sector, which currently accounts for 37.5%. The Finance sector, which at one time was the biggest sector in the index, currently accounts for 12%.
The chart below shows the group’s growth picture on an annual basis.
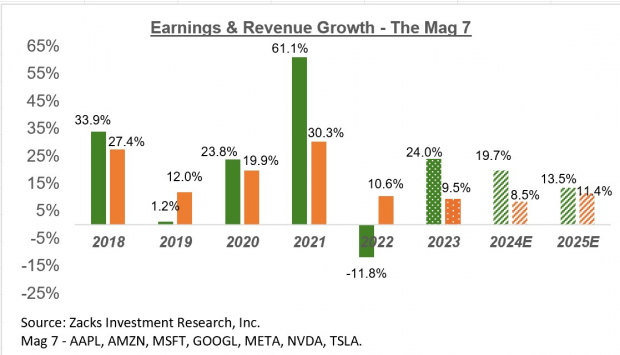
Image Source: Zacks Investment Research
Here is the overall earnings picture for the S&P 500 index on an annual basis.
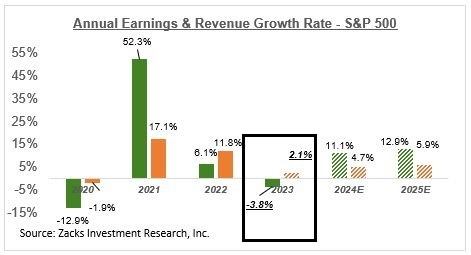
Image Source: Zacks Investment Research
Given the expected moderation in the U.S. economy’s growth trajectory due to the cumulative effects of Fed tightening, these estimates likely need to come down. But the +4.7% revenue growth expectation is hardly aggressive, considering that the U.S. economy produced a nominal GDP growth rate in excess of +6% last year.
The rest of the 2024 earnings growth is coming from margin expansion, with 2024 net margins for the index going up to +12.4% from last year’s 11.7%. Embedded in this margin expectation is the view that the inflation cycle has run its course, with easing cost pressures letting net margins return to the 2022 level.
We don’t see this margin (or revenue) outlook as unreasonable or out-of-sync with the economic ground reality."
That's a wrap for today.
2024 so far is giving investors quite a ride a quite a bang.
Let's hope we get some quiet in the Middle East.
Have a good one.
Peace.
More By This Author:
Thoughts For Thursday: Traders Have A Short Term Grail Quest
Tuesday Talk: A Good Month - Two Days To Go
Thoughts For Thursday: Indices Continue Climbing


Comments
Log in or sign up to join the conversation.